
This series now steps into the dark and murky realm of manufacturers’ wholesale pricing of product to see how the market has changed since 2013. The caveats remain the same:
- Big assumptions: Categorical lines separating Economy, Premium, and everything in between are arbitrary to some extent, reflecting the varying family of products, product-specific technology levels, and price points adopted by individual members of the Big 6.
- Incomplete data: Few will share. This isn’t a critique, it’s an economic fact of life. Price sharing is not a winning strategy in monopoly pricing.
- No data prior to 2004. Really, we’ve looked under every rock. But if you have some, please send it on.
- Transparency will win out, ultimately, but not in the past and not at the moment.
And so Hearing Economics foolishly rushes in where wiser heads avoid treading, continuing to “mine for morsels of truth.” The one advantage now is a few more years of data. Those extend the functions and paint more believable pictures to buttress the analyses. We’ll keep the analyses simple, in line with the ever-present Econ 101 series that pervades this section. Mostly, we’ll leave the figures to do the work.
Hearing Aid Retail Pricing Recap
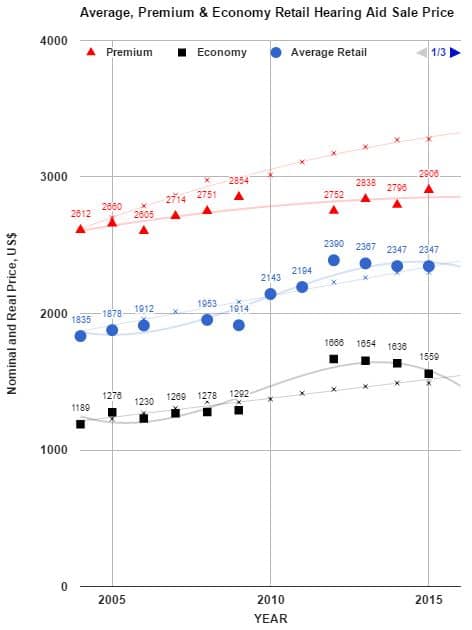
Figure 1. Premium (red), all-aid Average (blue), and Economy (black) average US price compared to inflation (cpi) since 2004.
Posts 1 and 2 in the 2016 Pricing series described retail hearing aid Price functions in the US market since 2004 (Fig 1). This much was established for the last decade:
- Average retail Price tracked inflation in the long run. It peaked in 2012 and has declined since.
- Economic Interpretation: On average, hearing aids behave like other items in the basket of goods used by economists to calculate the consumer price index.
- Premium retail Price was a flat function, rising only $27/year versus the $60/year needed to keep up with inflation.
- Economic Interpretation: The high end market is accessible to more consumers today, who can purchase premium products for $370 less than it cost them in real dollars a decade ago. At least in theory, the Demand curve has shifted right (more Quantity Demanded for same Price) as the result of technological innovation.
- Economy retail Price outpaced inflation for awhile but declined in recent years and is in line with inflation again.
- Economic Interpretation: It has taken a decade of market adjustments for this class of digital hearing instruments to gain clear definition. Now, it seems that Economy class hearing aids have found their place as well-behaving items in the economic basket of goods.
- Price range separating Premium from Economy instruments is $75 narrower now than in 2004 but narrowed by more than $350 in 2012. Meanwhile, the range of product differentiation has expanded considerably.
- Economic Interpretation: If price range continues to narrow, hearing instruments may approach the status of consumer electronic products with different consumers requiring varying degrees of tech support from audiologists and dispensers. Wireless technologies and sensor-laden ear level devices will further this trend even as technology-driven product differentiation expands.
Wholesale Hearing Aid Pricing Then and Now
In 2013

Figure 2. Wholesale pricing for hearing aids in three categories, from 2013 Price series.
The take-homes in 2013 for years 2004-2013 (Fig 2) were:
- Average wholesale Price tracked inflation.
- Premium wholesale Price kept pace with inflation but was high compared to other products on the market. Not surprisingly, manufacturers factored in price premiums for technological advances in this category.
- Economy wholesale Price was a flat function, meaning that these products were less expensive for consumers in successive years as Price fell below inflation adjustments.
- Price range did not contract across technology levels. There was little or no evidence of Price convergence and functions stayed roughly parallel to one another.
In 2016
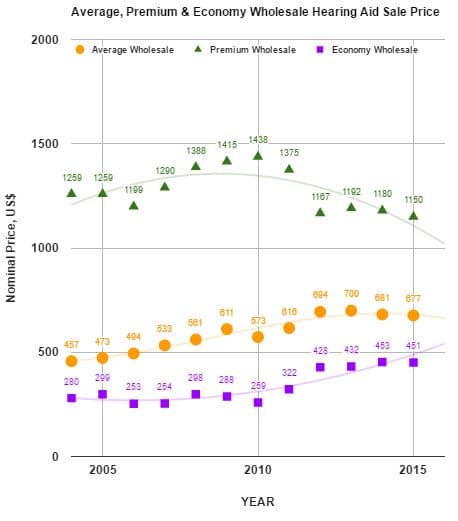
Figure 3. Wholesale Price for Premium (green), Economy (purple) and all-aid Average (gold) hearing aids in the US since 2004.
That was then, but what a difference a few years makes.
The wholesale market has a new look now and this is the big news. Dramatic changes in wholesale price functions in the last few years are manifest by comparing Fig 3 (now) to Fig 2 (then).1
- Average wholesale Price increased $18/year, slightly ahead of inflation (not shown but will be discussed in next week’s post).
- Premium wholesale Price switched direction from what we thought in 2013. Overall, it’s plummeted by -$9/year, with biggest drops occurring in the last 4 years.
- Economy wholesale Price increased $14/year, slightly outpacing inflation and contributing to the same trend in average sale price of all products.
- Price range converged by 28.6%, even more than observed in retail pricing. The gap between Premium and Economy instruments is $280 less in today’s currency than in 2004, almost as much as seen in the retail analysis ($293).
Interim Conclusions and Commentary
Headlines emanating from public policy groups, federal agencies, the popular media, and consumers are surfacing with increasing frequency this year. Their gist is that hearing aid prices are high and continually increasing. On the surface–in nominal dollars–and on average, the claim is supported at retail and wholesale levels (Figs 1 and 3, Average and Economy categories).
But going up compared to what? Measured how? The role of Hearing Economics is to bring economic thinking to bear on superficial claims, including those made when Price is treated like a political football. Just as our beloved decibel needs its .0002 dynes/cm2 to make sense, Price needs a reference value such as the consumer price index to make sense as well.
When Price is referenced to 2004 dollars2, we know from Fig 1 that inflation-adjusted Price isn’t rising in general and is actually falling for Premium products (Fig 1). Something similar (Fig 3) but even more dramatic is happening on the wholesale level and that is the subject of next week’s post.
References and Footnotes:
1Differences are mainly due to changes in the market, it’s important to note that the functions have been adjusted and fleshed out with more and better numbers from industry sources, adding corrections to the 2013 functions.
2CPI adjusted functions in the figures are intended to give readers a sense of inflation effects on the value of the US dollar by year, not to measure how wholesale hearing aid prices compare to the wholesale “basket of goods.” We can’t do the latter because we don’t have data for some of the variables needed to calculate PPI (producer price index) for hearing aids in the US market.
This is Part 3 of the 2016 Hearing Aid Price Series update. Click here for Part 1 and Part 2.

Amyn Amlani, PhD
Co-editor Amyn M. Amlani, Ph.D., is Professor and Chair of the consortium program in Audiology & Speech Pathology between the University of Arkansas for Medical Sciences and the University of Arkansas at Little Rock. Dr. Amlani holds the B.A. degree in Communication Disorders from the University of the Pacific, the M.S. degree in Audiology from Purdue University, and the Ph.D. degree in Audiology/Psychoacoustics (minor in Marketing and Supply Chain Management) from Michigan State University. His research interests include the influence of hearing aid technology on speech and music; economic and marketing trends within the hearing aid industry; and playing bass guitar in various heavy metal cover bands. Email: [email protected]


On what study or statics is your article based on? Some data or background information would be helpful.
Just know you are just giving the %, 10% up, 20% down…but from what numbers?
Right know, your article is not trustfull at all…
PS: Just have to reply to the “not trust” part. Please go back to the Pricing series from 2013, which is repeated referencedly by links in the present series. You will find everything up through 2013 already sourced. We are building on what is believed to be trusted data and certainly welcome better data to improve it, if you have it and if that is why you feel our information is suspect. Meanwhile, thanks for your interest and comment. Holly and Amyn
Hi Julian — as promised in part 1, the entire list of references for compiling the data will be published in a post soon (probably after part 2 of Wholesale prices). that way, all the data are up in figures and all the sources are compiled in one place for easy reference. In the meantime, suffice it to say that stats come from past MarkeTrak, as reported in Hearing Journal (when it still existed) and The Hearing Review, from some Phonak Survey reports, from a sneak peek at the recent Hearing Review survey, from a large US hearing aid buying group, and from an industry analyst who remains anonymous but well informed and reliable. OK? Thanks. Holly and Amyn