

Kelli Marquardt, BS
by Kelli Marquardt, BS (applied mathematics and economics)
On-going research on determinants of the labor market for audiologists is summarized in this series. The model was developed in Part 1. Data, data sources, and summary statistics are described in today’s post.
Analyses used a panel data set with observations for each US state and District of Columbia for the years 2009 to 2014.1 The analyses start in 2009 as that is the last year in which programs transitioned from a master to a doctoral program.2
Data Sources and Treatment, by Variable
- Bureau of Labor Statistics (BLS): This source was used to compile the total number of audiologists for each state and each year. In addition, the average salaried wage was also obtained from the BLS. To adjust for inflation, the average salaried wage was divided by the CPI with the base year of 1982.
- American Speech and Hearing Association (ASHA): The number of programs was obtained from ASHA yearly academic reports (CDS education survey data). These data are available from 2009/2010 school year to the 2014/2015 school year. The observations are recorded as the year of the respective fall semester.
- Costco Reports: Costco Annual Reports to shareholders and Costco 10-K Annual reports submitted to the Securities and Exchange Commission were accessible through Internet searches for most years included in the present study.
- Sources for other variables used in the model were:
- BLS: the unemployment rate, represented as annual averages.
- Bureau of Economic Analysis: per capita income, adjusted to real values given the CPI with base year 1982.
- US Census: total population and percentage of the population 85 years and older.
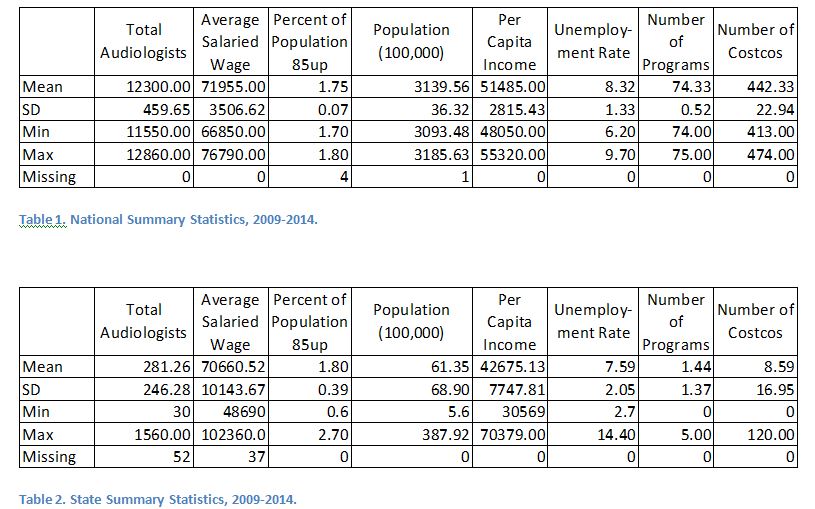
Summary Statistics
Table 1 shows the national summary statistics for the variables of interest and Table 2 shows the state summary statistics from years 2009 to 2014.
Change Over Time
Since we are analyzing panel data, a better way to understand the data is to visualize the progression of variables over time. Plots are on the national level, but are representative of the trends within states.
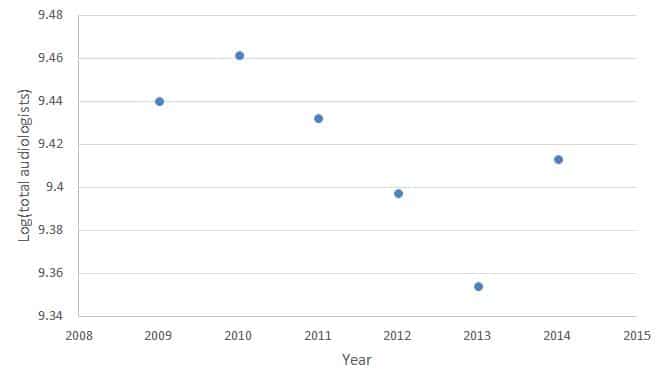
Figure 1. Number of audiologists trend.
Figure 1 shows the quantity of audiologists across time.
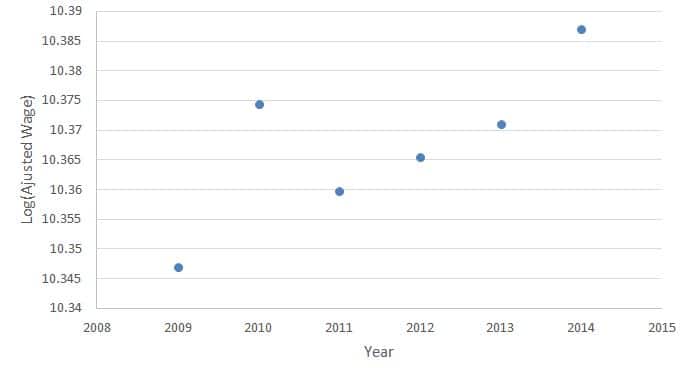
Figure 2. Real annual earnings trend.
Figure 2 shows the real annual wage trend across time, which are generally increasing over time. This can be indicative of a rise in demand, a fall in supply, or both. Along with Figure 1, we see a scatter of equilibrium quantities which is indicative that over time the market experiences both a shift in supply and a shift in demand. The analysis of this paper attempts to predict the indicators of these shifts
.
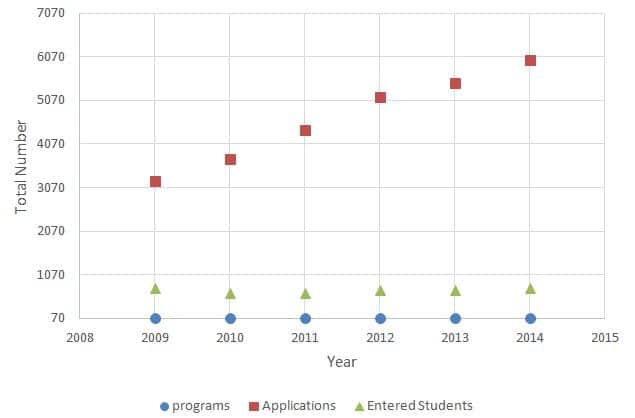 Figure 3 shows both the number of programs over time along with the number of applications and entering students. While the number of programs and number of entering students stays relatively constant over time, the number of applications increases.3 This suggests that the supply for audiologists would be increasing had there not been a static program and acceptance rate.
Given the model, the identification strategy, and the data, we can now summarize the results in Part 3 of this series.
Footnotes
1 This results in 306 potential observations. However due to missing observations, we are left with 254 total observations for the final analysis. For example, Alaska did not report the number of audiologists to BLS and thus is removed from the analysis.
2 Some states require a 4 year AuD degree to practice audiology while some other states still only require a Masters. Unfortunately, we do not have a variable that represents this requirement because dates of transition by state are not compiled in an accessible database, to our knowledge. In addition, for states with the doctoral requirement, audiologists already in the workforce were grandfathered in under licensure laws. We ask readers with knowledge of years of licensure changes in their states to please share this information with us (email to [email protected]).
3 The increase in applications may reflect growth of total number of perspective students or a growing trend for applicants to apply to multiple programs. Efforts to obtain data in this regard are under way.
Data Source Access
Bureau of Labor Statistics, U.S. Department of Labor, Occupational Employment Statistics, [Jan. 26, 2017]. For example, the 2011 Audiologist report.
Communication Sciences and Disorders (CSD) Education Survey Data Reports. [Feb 17, 2017]
Costco Wholesale Fiscal Year Annual Reports (relevant years). [Mar 25, 2017]
Costco Annual 10-K financial reports to SEC (e.g., FY 2015 10-K). [Mar 25, 2017]
U.S. Bureau of Economic Analysis, [Feb. 17, 2017]:
United States Census. State Population Totals Tables: 2010:2016, [Jan 18, 2017]
Kelli Marquardt is an Economics PhD Candidate at the University of Arizona. After growing up in Colorado, she attended the University of Dayton and received a Bachelors of Science in Applied Mathematics and Economics in 2016. She has completed her first year in the University of Arizona Economics PhD program and plans for future research in the fields of labor and health economics. Between classes and research, Kelli also works as an teaching assistant and will teach her first college course this summer.