Last post in the Costco series initiated rudimentary analyses of hearing-related market growth in the US by comparing aggregate variables in the top 25 states ranked by Costco presence (“Top” states) versus the lower 25 states (“Bottom” states). Top states exceeded Bottom states, in adjusted per capita measures (feature image). Compared to Bottom states, the Top 25 states feature:
- 4 times as many Costcos
- 19% more hearing aids sales to adults 50 and older
- 17% more audiologists and 55% more dispensers for adults 65 and older
- 10% higher average audiology wage
- increasing rate of Medicare-billed hearing tests, versus a decreasing rate in Bottom states
Meanwhile, an economic study of trends in the US audiology work force reported price elasticity of demand for audiologists, with a 4.1% drop in demand for audiologists for every 1% increase in audiology wage. At the same time, the report found that the number of Costcos in a state decreases the quantity of audiologists demanded in the state.
Are Top States Bigger and Better?
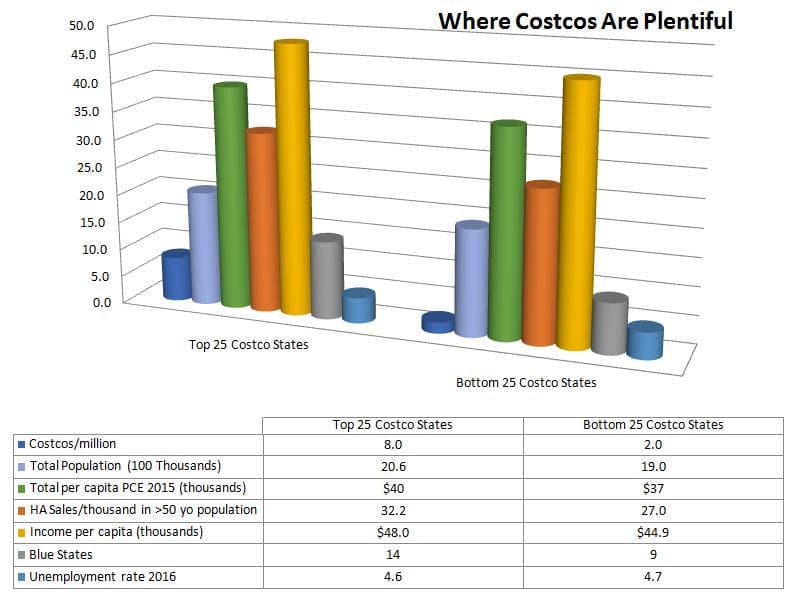
Figure 1.
What attracts businesses, professionals and hearing aid consumers to Top states? Last post tossed out a plethora of candidates that could be lures:
- larger populations
- wealthier and healthier populations, especially in the aging segments
- better climate, politics, social services, rents, etc.
Figure 1 is a snapshot of some of these variables, aggregated by Top and Bottom states.1 The graph and supporting table tell the basic story. Top states are more populated. On average, residents of Top states are younger, wealthier, and spend more.2 They’re also less conservative and slightly more likely to be employed than their counterparts in Bottom states.
Speculation in Need of Substantiation
Top state residents purchase at least 400,000 more hearing aids per year than Bottom state residents. This raises the possibility that the average age of hearing aid acquisition is lower in Top states since their aggregate populations are younger.
Fitting at an earlier age implies fitting milder hearing losses, on average. If so, then at least some of those additional 400,000 sales may be the kind envisioned by the emerging OTC template of low-cost fitting and low professional maintenance.
A good portion of the extra sales in Top states are transacted at Costco Hearing Aid Centers. Using the logic above, this raises the possibility that Costco shoppers tend to pick up their hearing aids sooner in life and for milder losses than the national averages. The low-cost, easy-access Costco Way may suit the needs of these consumers and foreshadow current social policy discussion. At least for its members, Costco’s rapid sales growth may have already validated and usurped the goals of OTC advocates and current legislation to “make cheaper hearing aids cheaper, easier to buy.” Of course, this is all just speculation because Costco is not about to share its hearing aid sales demographics.
On the other hand, maybe Top states are just top heavy in healthy older folks who buy their hearing aids through traditional distribution channels. That would be an intuition if you associate hearing aids with aging, but a look at the Bottom states suggests the intuition is not entirely on target.
What About Bottom States?
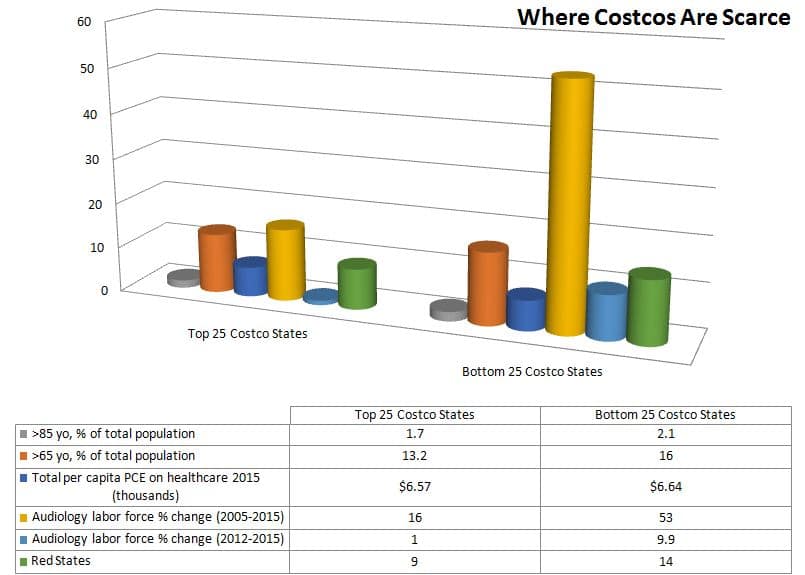
Fig 2. Characteristics of Bottom states.
In fact, Bottom states excel in the Senior department. Those states have almost 3% more >65 year-olds and 0.4% more “oldest old.”
The tilt toward seniors may explain why residents of Bottom states spend proportionately more on healthcare than their wealthier Top state mates. But it doesn’t explain why substantially fewer hearing aids are consumed per capita in states with proportionally larger aging populations.
Bottom states’ magnetic pull on seniors also draws audiologists. Perhaps these states were under-served before, but their audiology work forces have grown rapidly — over three times as fast as Top states in the last decade and a whopping 10 times as fast since 2012.
You’d think an increasing audiology workforce would sell more hearing aids or at least increase the rate of Medicare-billing for hearing evaluations, but neither outcome has resulted. The demand for audiologists is increasing, but who is demand them and what are they demanded to do?
More Unsubstantiated Speculation
Bottom states have higher unemployment. That suggests proportionally more Medicaid recipients, including families with children.
Audiologists’ migration to Bottom states could be predicated in part on state-based Medicaid regulations which require diagnostic hearing evaluations by licensed audiologists. Economic modeling of the audiology work force found (but did not explore) a “significant and positive effect of overall unemployment rate on quantity demanded of audiologists” on a state-by-state basis.
Might overall lower hearing aid sales be characteristic of states with larger Medicaid enrollments since not all state regulations mandate adult hearing services coverage? Costco Hearing Aid Centers do not participate in Medicaid programs (or other insurances) and would not be attracted to regions with larger Medicaid cohorts. Even in Top states, Medicaid recipients may be under-represented in Costco memberships. This is just speculation because Costco is not about to share personal information about its members.
Enough Speculating, Time to Expand the Model
To the extent that time and data allow, some or all of these unsubstantiated thoughts may be pursued in future modeling. As always, data from any and all verifiable sources are much appreciated.
Footnotes
1 In order to fit everything proportionally into the graph to get the visual, the data are not all to the same scale (see legend below graph), but the purpose is served.
2 PCE = Total Personal Consumption Expenditures.