
Predicted PTS (Permanent Threshold Shift) From Hearing Aid Use
Various researchers have utilized data from TTS (Temporary Threshold Shift) and ITTS (Integrated Temporary Threshold Shift) in formulae that have included the length of time worn during the day, number of years worn, age at which the aid was first worn, the gain level used, and the hearing aid’s output. These have been used to estimate irreversible hearing loss from wearing hearing aids.
Analyses indicate that the eventual NIPTS (Noise Induced Permanent Threshold Shift) due to hearing aid use can be estimated from measurements of hearing aid-induced ITTS obtained from normal-hearing young adults. However, a critical limitation is that it is not feasible to assess the ITTS resulting from high-powered amplification worn for typical lengths of usage without jeopardizing the hearing integrity of the subject.
An alternative is to record typical “noise doses” associated with hearing aid use. These are obtained directly from hearing aid amplification output measurements in various listening environments (aid output measured, but not worn by subjects). The difficulty even with such noise dosage measurements is that the conditions of actual amplification that would occur in a “normal” listening environment could not be reasonably duplicated. Additionally, such an attempt would assume that the hearing aid would be worn at full-on gain, when an actual user might adjust the gain for different listening environments. For example, hearing aid wearers often reduce the gain in louder environments (if the hearing aid allows this), adjust one of the settings of the aid for a noise environment (again often reducing gain), or the hearing aid circuitry makes gain adjustments as a result of monitoring the incoming signal.
Threshold Shift Versus Shifted Threshold
Interpreting threshold shifts obtained from listeners who already have a hearing loss is much more difficult to predict than it is from measuring TTS on normal-hearing adults. Still, it is well known that the greater the pre-exposure hearing level, the more TTS decreases {{1}}[[1]] Glorig, A., Ward, W.D., & Nixon, J. Damage risk criteria and noise-induced hearing loss. Archives of Otolaryngology, 1961, 74,413-425[[1]]. This makes it a much more difficult task to interpret their threshold shifts.
As an oversimplified example, if a normal hearing individual could expect a predicted NIPTS of 55 dB, that would also be that person’s post-exposure shifted threshold (ST). However, if the person had a hearing loss of 40 dB, an ST of only 15 dB might occur (to a level of 55 dB); and for a person with a hearing loss of 80 dB, the ST might not change – remain at 80 dB. Ward {{2}}[[2]] Ward, W.D., Adaptation and fatigue. In J. Jerger (Ed.), Modern Developments in Audiology (2nd ed.), New York: Academic Press, 301-344, 1973[[2]] has shown that pre-exposure audiometric configurations can also exert an effect on the post-exposure ST, and that in some special cases, the predicted ST may be an underestimation of that actually observed.
The rationale for selecting shifted threshold (ST), as opposed to threshold shift, to measure the noise-induced damage found among hearing-impaired listeners is based upon findings in laboratory animals {{3}}[[3]] Mills, J.H. Threshold shifts produced by exposure to noise in chinchillas with noise-induced hearing losses. Journal of Speech and Hearing Research, 1973, 16, 700-708[[3]] and humans {{4}}[[4]] Humes, L.E. TTS for masked pure tones. Audiology, 1980, 19,335-345[[4]].
Few studies have examined TTS developed in hearing aid wearers under controlled exposure conditions, and even fewer have evaluated other independent variables that could affect hearing. However, recognizing that some risk is associated with the use of amplification, and taking into consideration all of the information related to TTS and NIPTS, Humes and Bess {{5}}[[5]] Humes, L.E., and Bess, F.H. Tutorial on the potential deterioration in hearing due to hearing aid usage, J. Speech and Hearing Research, 46, 3-15, 1981[[5]] provided some guidelines to minimize that risk. In reviewing these guidelines, it is interesting to compare how hearing aids are fitted today with what Humes recommended so many years ago. A major feature lies in his attempt to predict the output and gains recommended based on the pre-exposed hearing level and based on the number of years the hearing aid was expected to be worn.
Humes & Bess (1981) Recommendations
Hearing Aid Output Levels
Keep in mind that these recommendations relate only to 4000 Hz. This frequency was chosen because it shows the greatest amount of threshold shift. While this does not show the impact of ST at other frequencies (whose critical factors are different), it nevertheless identifies some rather interesting trends as to the impact of pre-exposure hearing levels, hearing aid performance, and length of expected time that a hearing aid would be worn for damage to occur.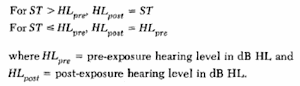
Figure 1 displays “critical output levels.” The lines reflect the various combinations of output level and length of usage that will yield various STs. These STs are then interpreted according to the equation on the right.
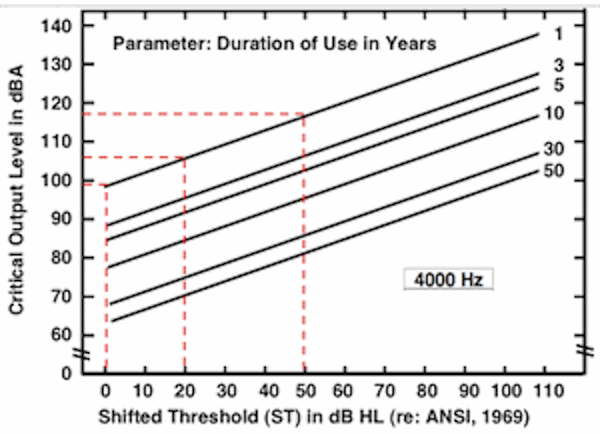
Figure 1. Calculated critical output levels for 4000 Hz for varying durations of use of amplification. The ordinate represents the average continual output and should not be interpreted as SSPL values.
Figure 1 suggests that (at 4000 Hz) if a 20-dB shifted threshold (ST) occurs, the relationship between the ST and the average continual output the person is exposed to in years is as follows:
1 year To show a 20 dB ST = 107 dBA average continual output
3 years To show a 20 dB ST = 96 dBA average continual output
5 years To show a 20 dB ST = 90 dBA average continual output
10 years To show a 20 dB ST = 82 dBA average continual output
30 years To show a 20 dB ST = 73 dBA average continual output
50 years To show a 20 dB ST = 68 dBA average continual output
The connected dashed lines at 0 and 50 dB shifted thresholds are provided for comparison purposes.
A word of caution should be expressed about Figure 1. The critical output levels are not protective limits for hearing aid output. Instead, these are levels such that if a hearing aid were worn for twelve hours with an output of 98-106 dBA, the specified STs would be observed. This means that the output can exceed these critical values from moment-to-moment as long as the average level during the entire 12-hour period does not exceed this critical limit. Hence, in setting the output limit for an amplification device, values above those shown in Figure 1 may be specified in some cases. Additionally, in applying the critical levels of Figure 1, a daily period of use of 12 hours is assumed. For shorter or longer periods of use, the curves in Figure 1 should be adjusted accordingly.
Critical gain values can also be derived, again assuming a typical average daily input level for the 12-hour period of use, and subtracting this value from the critical output levels shown in Figure 1. An average input level of 60 dBA has been assumed. When doing this, the critical gain values of Figure 2 result. For a given expected duration of usage and pre-amplification hearing level (abscissa), gain values exceeding those in Figure 2 will cause further deterioration in hearing sensitivity. For example, if a person has a pre-amplification hearing level of 40 dB HL at 4000 Hz, the gain must not exceed 33 dB if there is no further hearing loss due to amplification fifty years later (light dashed lines). Pre-amplification for a hearing level of 80 dB is shown as a comparison.
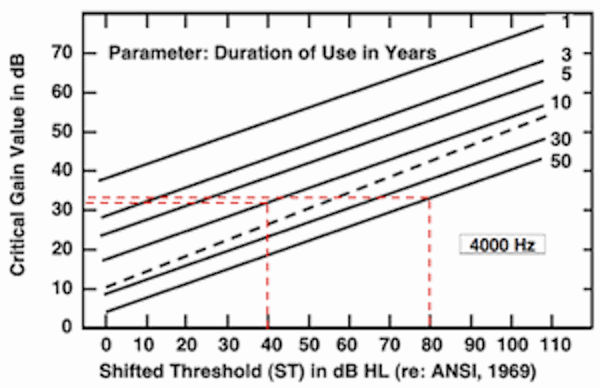
Figure 2. Critical gain values as a function of hearing level for various durations of hearing aid use (solid lines). The heavy dashed climbing line represents an approximation of the functions observed typically in studies of “as-worn gain” as a function of hearing level (essentially the half-gain rule).
When making recommendations regarding safe limits for hearing aid output at frequencies lower than 4000 Hz, the critical output and gain values would be adjusted by some unknown amount. For example, a rough estimate to protect hearing at 500 Hz might adjust the critical gain value upward by about 20 dB. The values shown were selected on the basis of projecting a number that is equivalent to the NIPTS of 4000 Hz.
What Does All This Mean?
- Individuals who have a hearing loss prior to additional amplification from the hearing aid are more likely to show a change in hearing, but the magnitude of the change depends on the degree of pre-amplified hearing. The greater the hearing loss, the less effect hearing aids are projected to have on hearing.
- All hearing loss levels, at least for the past two decades, have been fitted with hearing aids having substantially reduced saturation outputs from those of hearing aid fittings prior to that time. This has the effect of limiting overamplification and preserving hearing.
- Many hearing aids utilize circuitry that monitors amplification levels, and, when a critical output level is reached, either limits or compresses hearing aid outputs.
- History is on the side of hearing aids not causing additional hearing loss. If they did cause further hearing loss, research and actual utilization of hearing aids would reflect this. Millions have been fitted with hearing aids and their use does not reflect further loss. Of course, this assumes that other factors such as advancing age, medications, etc., are isolated from the impact of loud sounds.
- Noise reduction/cancellation circuitry is commonly employed in hearing aids to reduce the impact of loud noises – both impact and steady-state signals.
- Hearing aids do not function at full-on gain and output all the time because the input signals often have periods of quiet or low-level inputs.
- Feedback-reduction circuits limit the amount of acoustic feedback, which is exhibited with very loud amplified signals.