
Hearing Aid Age, Type, and Coupling – Latest Results From MarkeTrak 9
 MarkeTrak 9 (MT9){{1}}[[1]]MarkeTrak 9: A New Baseline. Estimating hearing loss and adoption rates and exploring key aspects of the patient journey, Final Report, March 2014, Hearing Industries Association[[1]] was provided to Hearing Industry Association (HIA) members in early April, ahead of public release, and HHTM was first to publish data from the Report at Hearing News Watch. This confidential 183-page report, titled MarkeTrak 9: A New Baseline, was conducted as an online survey using a large, multi-source sample of hearing aid owners and non-owners during the fall of 2014.
Unlike previous MarkeTrak surveys, MT9 was designed to form a new baseline of data to provide a solid backdrop on the hearing aid market, and also to serve as a reference and starting point for future analyses and publications, as well as follow-up research. It is worth noting that because MT9 data was gathered via an online survey, the data cannot be directly compared with previous MarkeTrak surveys, which all used mail responses. Additionally, MT9 used the term “hearing difficulty” instead of “hearing loss” (used in most of the previous MarkeTrak studies) to soften the condition (and get more people who suffer hearing loss to admit it). How this may have impacted the data is not known.
Hearing Aid Trends
This post provides a preliminary review of one small data set from the MT9 Report – one that relates directly to hearing aids and curent trends – that of basic hearing aid features. The data reported here is taken from Part 2 of the survey, which was collected from 980 current hearing aid owners.
Average Age of Currently-Owned Hearing Aids
The average age of currently owned hearing aids is 3.3 years, with time of ownership shown in percent (Figure 1). This compares to 4.1 years in 2008 (MT VIII), and to 4.5 years in 2004 (MT VII). It appears that over half of the sampled population own relatively new hearing aids–less than about 3 years. The age of ownership over this ten-year period seems to suggest a trend toward more frequent replacement of hearing aids. It is tempting to think this might be related to improved design and performance features. However, because the survey methods between MT9 and previous MarkeTrak reports are different, this apparent 5.4% increase in percentage of hearing aid users between 2004 and 2014 should be viewed cautiously.
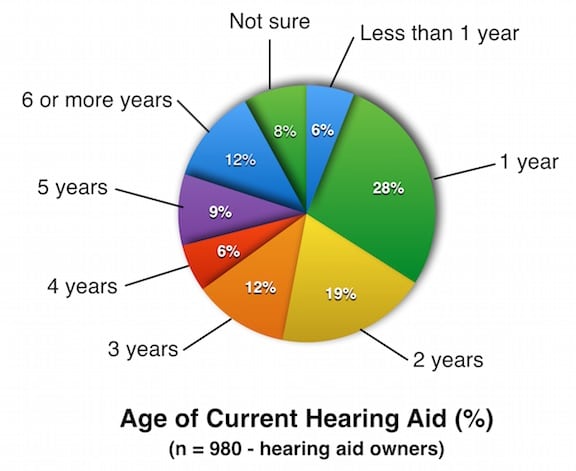
Figure 1. Average age of aids by users is 3.3 years. Charted from MT9 data.
Hearing Aid Types
RIC (receiver-in-the-ear) hearing aids are the most commonly owned type of hearing aids, as reported in the MT9 survey at 46%, by a rather substantial margin. This is followed by ITCs (in-the-canal) at 14%, and BTEs (behind-the-ear) and ITEs (in-the-ear) at 11% each, as shown in Figure 2. Other types have a smaller percentage of ownership as shown in the graph.
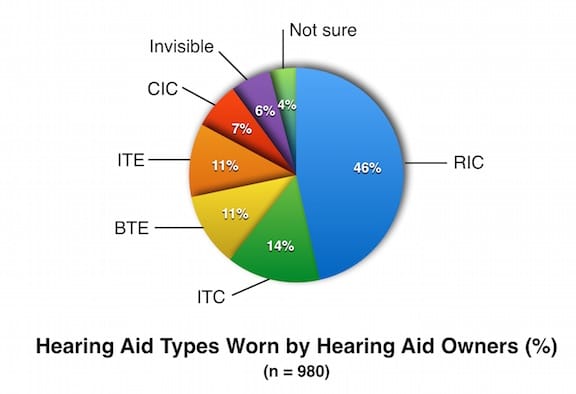
Figure 2. Hearing aid type worn. Key: RIC (receiver-in-the-canal), ITC (in-the-canal), BTE (behind-the-ear), ITE (in-the-ear), CIC (completely-in-canal), invisible (not seen when inserted). Charted from MT9 data.
BTE Hearing Aid to Ear Coupling
Owners of BTE style hearing aids (both RIC and traditional) were asked to classify “the part of the hearing aid(s) that connects to the tube that fits inside the ear.” Their responses are provided in Figure 3. A custom earmold was described to hearing aid owners as one specifically created to securely fit the shape and size of the ear. An off-the-shelf was described as a silicon or sponge-like dome. These percentages should be analyzed more specifically because they seem to be inconsistent with Figure 2. For example, Figure 2 shows about 559 total BTE instruments (RIC plus BTE). If the percentages of Figure 3 are correct, this suggests that 363 of 559 couplers are custom-molded, and that just 112 are “off-the-shelf.”
Custom earmolds for the BTE category instruments (108 units) are expected. However, this would still mean that the majority of the 451 RIC instruments (46%) are fitted with custom earmolds. Of course, this is probable. Still, one has to wonder if “custom-made to fit the shape and size of the ear” might have been interpreted by some owners to relate to the selection of the correct dome size and style. This issue will require some further exploration. Data is not immediately available.
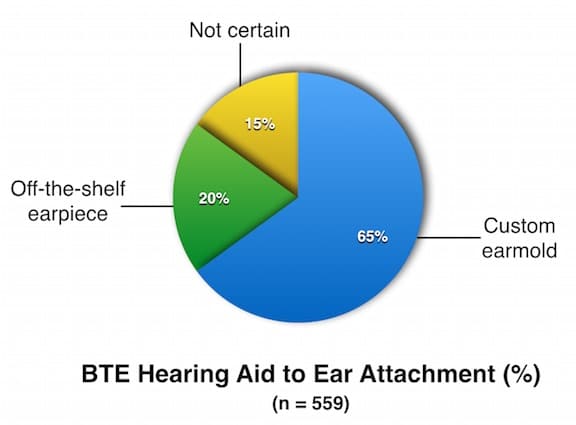
Figure 3. Type of “earmold” used to deliver the sound from the BTE (behind-the-ear) type hearing aids to the ear. Charted using MT9 data.
Next week’s post will continue to provide the latest data from MarkeTrak 9 related to hearing aids and will focus on features in current hearing aids, wireless, and external apps.


Pew Research Center: Older Adults and Technology Use, April 3, 2014:
http://www.pewinternet.org/2014/04/03/older-adults-and-technology-use/
America’s seniors have historically been late adopters to the world of technology compared to their younger compatriots, but their movement into digital life continues to deepen, according to newly released data from the Pew Research Center. In this report, we take advantage of a particularly large survey to conduct a unique exploration not only of technology use between Americans ages 65 or older and the rest of the population, but within the senior population as well.
Two different groups of older Americans emerge. The first group (which leans toward younger, more highly educated, or more affluent seniors) has relatively substantial technology assets, and also has a positive view toward the benefits of online platforms. The other (which tends to be older and less affluent, often with significant challenges with health or disability) is largely disconnected from the world of digital tools and services, both physically and psychologically.
As the internet plays an increasingly central role in connecting Americans of all ages to news and information, government services, health resources, and opportunities for social support, these divisions are noteworthy—particularly for the many organizations and individual caregivers who serve the older adult population. Among the key findings of this research:
Six in ten seniors now go online, and just under half are broadband adopters
In April 2012 the Pew Research Center found for the first time that more than half of older adults (defined as those ages 65 or older) were internet users. Today, 59% of seniors report they go online—a six-percentage point increase in the course of a year—and 47% say they have a high-speed broadband connection at home. In addition, 77% of older adults have a cell phone, up from 69% in April 2012.
But despite these gains, seniors continue to lag behind younger Americans when it comes to tech adoption. And many seniors remain largely unattached from online and mobile life—41% do not use the internet at all, 53% do not have broadband access at home, and 23% do not use cell phones.
Younger, higher-income, and more highly educated seniors use the internet and broadband at rates approaching—or even exceeding—the general population; internet use and broadband adoption each drop off dramatically around age 75.
Seniors, like any other demographic group, are not monolithic, and there are important distinctions in their tech adoption patterns, beginning with age itself. Internet use and broadband adoption among seniors each fall off notably starting at approximately age 75. Some 68% of Americans in their early 70s go online, and 55% have broadband at home. By contrast, internet adoption falls to 47% and broadband adoption falls to 34% among 75-79 year olds.
Balance at:
http://www.pewinternet.org/2014/04/03/older-adults-and-technology-use/