
A number of years ago, an article was published describing the importance of the impedance formula in interpretation of audiograms1. The article by Campbell offered a fairly simple and visible way to help understand the audiogram, based on stiffness and mass, and the impact of these two elements on conductive hearing loss. It is recognized that today more sophisticated methods for making these determinations are available, but the opportunity to view the air-conduction audiogram alone, without bone-conduction measurements, in cases of conductive hearing impairment, and to make a rapid assessment of the underlying cause, holds some kind of fascination.
The use of the impedance formula by Campbell, as used by engineers and physicists for a number of years, provided the foundation for this application. The formula applied to look ![]() at stiffness and mass effects was as follows:
at stiffness and mass effects was as follows:
f = frequency r = friction M = mass S = stiffness
The formula states that factors which increase the stiffness of any element of the conductive system will produce hearing loss predominantly in the lower frequencies. Factors that increase the mass of any of the elements of the conductive system produce hearing loss predominantly in the high tone area.
Impedance
Any resistance to the transmission of vibratory energy by a sound conduction system, can be identified as impedance. By this definition, practically all forms of conductive hearing loss are due to impedance. It was thought that if the cause of impedance could be determined, there would be a good probability of determining the cause of the hearing loss. And, if the clue to the various causes of impedance could be identified by characteristic pure-tone audiometric curves, another important tool for differentiating etiological factors in conductive loss would be available.
Seesaw Analogy
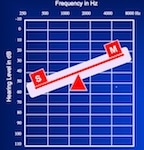
Below is a seesaw analogy of the impedance formula as it relates to the audiogram2. Analogies are shown for normal hearing (Figure 1), hearing levels affected by stiffness factors related to the conducting mechanism (Figure 2), and hearing levels affected by mass factors related to the conducting mechanism (Figure 3).
Normal Hearing

Figure 1. The analogy for normal hearing. Neither stiffness (S) nor mass (M) has a significant influence on the measured results. The hearing levels are assumed somewhere around the light shaded area.
Stiffness Factors

Figure 2. When stiffness is a factor (or when mass is decreased), the hearing thresholds for air-conduction testing can show poorer hearing in the low frequencies. The general A/C thresholds tend to follow the light shaded area, but obviously, with some deviations.
Common causes resulting in an increase in the stiffness of elements in the conduction system (not a complete list):
- Unequal pressure on the two sides of the tympanic membrane
- Fixation of the footplate of the stapes
- Endolymphatic hydrops
- Adhesions between the ossicles, or between the ossicles and wall of the middle ear
Mass Factors

Figure 3. When mass is a factor (or when stiffness is decreased), the hearing thresholds for air-conduction testing can show poorer hearing in the high frequencies. The general A/C thresholds tend to follow the light shaded area, but obviously, with some deviations.
Common causes resulting in an increase in the mass of elements in the conduction system (not a complete list):
- Thickening of the tympanic membrane
- Hemorrhagic blood on the tympanic membrane
- Pus, blood, or serous fluid in the middle ear
- Organized exudate in the middle ear
- Localized hemorrhage into the substance of the tympanic membrane
Combined Stiffness and Mass
It is common for combined stiffness and mass increases of the elements of the conduction system. A short listing of these includes:
- Negative pressure in the middle ear with consequent serous fluid production
- Purulent otitis media with positive pressure and pus production
- Organizing pus, blood, or serous fluid in the middle ear.
- Many otitis media cases start as stiffness factors (rising-with-frequency A/C hearing thresholds), but move to demonstrate mass factors (falling-with-frequency A/C hearing thresholds) as the problem progresses.
Summary
The intent of this post is not to suggest bypassing current and excellent methods for evaluating conductive hearing losses, but to demonstrate how stiffness and mass affect the air-conduction thresholds, and that even with that information alone, some inferences may be made about the underlying causes of the hearing loss.
References
- Campbell, P. The importance of the impedance formula in the interpretation of audiograms. (1950). Transactions of the American Academy of Ophthalmology and Otolaryngology, 54: 245-252.
- Johansen, J. (1948). Relation of audiograms to the impedance formula, Acta Oto-Laryngologica, Vol. 36, Issue Sup. 74.


Excellent !
However, the application of stiffness and mass to speech sounds does have implications, more when mass is involved , along with the input of typical low frequency male voices. Tracking the history of ear infections, and the associated tymps will help in the proper readjustment of hearing aid settings.
Thanks !
Thanx. For reinterring the two articles by Campbell and Johansen. I ran across them in the early 60s, was impressed, and used them to dazzle the ENTs I worked with at the time. This was before impedance testing infiltrated audiology. As time passed, and progress made the theory of less value, it lived in my mind’s dusty recesses, but only as an interesting half-forgotten memory. Until your article I thought I was the only person left on earth who still remembered the articles. Good on ye!
Jim:
It is rather amazing how much good, previous information is not readily presented to hearing professionals. Those two articles have stuck with me throughout the years and help explain many of the things I see on audiograms.