
This is a really neat topic, even if the title is really boring. “Control methods….” of anything sounds dull. This is actually a stolen title off an historically important article from the 1950s “Control Methods used in a study of vowels” by Gordon Peterson and Harold Barney (1952).{{1}}[[1]]Gordon E. Peterson and Harold L. Barney, “Control Methods Used in a Study of Vowels.” Journal of the Acoustical Society of America 24(2):175-184, 1952.[[1]] That article sat on my desk during graduate school looking me in the eye for weeks. I refused to look at it. One night, curiosity got the better of me (and I had drunk a couple of beers… I mean cups of tea) and I decided to read it. Well, I was right. It was really boring, but it did talk about the correct way to assess vowels for acoustic analysis.
Control methods in assessing musicians’ earplugs is much more interesting than the 1952 Peterson and Barney article, and every bit as necessary. How one assesses a musicians’ earplug is as important as the actual result that you can obtain. There is a right way and a wrong way.
This is not meant to be an exhaustive overview of every possible way to assess hearing protection, but this approach can work for every possible form of hearing protector imaginable. Some may require a slight alteration (e.g., longer probe tube microphone and perhaps a disabling of the reference microphone), but here are the essentials.
First, go out and get a probe tube microphone, also known as a real ear measurement system. If you don’t have one, you should write this into this year’s budget- it can be every bit as important as your audiometer. Alternatively, make friends with someone who does own one.
Calibrate the real ear measurement system in the normal fashion to delete any effects of the probe tube and room acoustic effects, then select a stimulus value of 70 dB SPL or higher.
This stimulus intensity may seem odd. We are used to using a level of 50-55 dB SPL for soft speech (and maybe a bit higher for medium and loud speech), so why are we using a level of 70 dB SPL? Unlike hearing aid “amplification”, hearing protectors have “attenuation”. That is, with normal use of a real ear measurement system with hearing aids, the gain is positive- the output is greater than the input. This is rarely the case with hearing protectors. These can be thought of as hearing aids with negative gain- the output is less than the input.
A stimulus level plus gain (positive or negative) should be greater than the noise floor of the real ear measurement device. With hearing aids, this is rarely an issue, although we can run into this problem in the very low and very high frequency regions. With hearing protectors we can run in to the noise floor of the measurement equipment quite easily without knowing it.
To check the noise floor of your (or your friend’s) real ear measurement system, after calibrating the equipment in the normal fashion, plug the end of the probe tube with pinched fingers or a pair of pliers, set the stimulus level to 0 dB (as in the case of the Audioscan products), or set the stimulus level to “off” (if you are using a Frye system). Performing a run of the equipment (either a sweep or an FFT) will generate a graph of the internal noise levels on a frequency by frequency basis. You can also do this at social events and become the life of the party!
Typically you will find that the noise floor is slightly high in the very low frequency region, very low in the mid frequency region, and again higher in the very high frequency region.
When assessing hearing protection, if the stimulus level + attenuation of the hearing protector (or equivalently – gain) is anywhere near the internal noise measurements on your real ear measurement system, there is really no way to tell whether you are measuring the internal noise or the attenuation of the hearing protector. We run into the same problem when assessing otoacoustic emissions- if we have a measurement that is within 10 dB of the noise floor of the instrument, there is not much that can be definitely said about that measurement.
So, if we use a stimulus level that is higher- say around 70 dB SPL- then we can be assured that whatever we measure is the true attenuation at the measured frequencies.
With musicians’ earplugs (such as the ER-15) which are supposed to have a flat or uniform attenuation across the frequency range, we should get a relatively flat line at 55 dB SPL (i.e., 70 dB SPL- 15 dB). Of course, there is some variance and in the 2000-3000 Hz region this has everything to do with the slight variation in the individual’s ear canal resonance (or REUR for those of us who actually use a real ear measurement system. If you are just borrowing one for a friend, it’s OK to call this natural resonance the “ear canal resonance”). Low frequency variance in any measured data is typically related to the slit leaks caused by the presence of the probe tube and the resulting sound leak between the ear canal wall and the hearing protector.
The following graph shows the real ear attenuation of 50 randomly selected files of my musician clients with their ER-15 in place. This shows the average for both left and the right ears as well as the range of the data. I should also add that the stimulus is always directed from 45 degrees to the test side and 45 degrees above them- a location that is not only optimal for the assessment of real ear measures, but that happens to be exactly where my loudspeaker is located for my real ear measurement system. Any errors in the lower frequency region tend to be related to slit leaks between the ER-15 earplug and the person’s own ear canal. If I were doing research, I would have used a bit of Vaseline (or some other sufficiently gooey substance) on the side of the probe tube to ensure that there were no leaks.
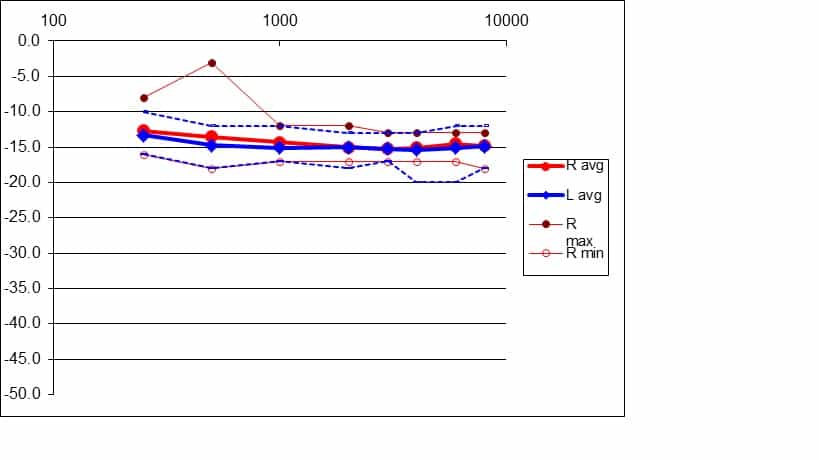
Average attenuations for 50 pairs of ER-15 hearing protectors showing the maximum and minimum values


How about that, they actually do work! Just kidding, of course! What would be interesting, Marshall, is to overlay your plot with the average attenuation of non-flat attenuating earplugs of a particular type. Also, the dotted blue lines, are those the L max and L min lines?
Hi Scott- good catch! The dotted blue lines are indeed the min and the max for the left ear fittings. It should be pointed out that these are “ranges” and not standard deviations which are much smaller. The ER-15 do indeed provide a uniform attenuation for musicians. With over 1 million sold (and 2.5 million one-size-fits all ETY musicians’ earplugs sold) musicians are clearly getting significant real life benefit. I can’t tell you how often I get panicked phone calls from musicians who have misplaced them and need new ones immediately. The research, clinical, and real life data all support the utility of a uniform attenuators earplug such as the ER-15.
And the last post was from me! Still getting used to my small screen iPad and I didn’t see the “name” section until after I had sent it :). Marshall