
Q: “Does it really cost $600 or more for the manufacturer to ship a hearing aid to me versus to Costco or the VA?” Sincerely, RR
Last post considered RR’s plaint that big competitors’ product Costs are lower than his, so his profit margins are necessarily smaller than theirs, no matter how careful he is with his operating costs. RR wanted to know why there wasn’t a level playing field and posed the Question shown above. Today’s post continues the stem-winding effort to Answer his question. The beginnings of an answer took the form of a prescription for Bitter Pills that firms in competitive markets must swallow:{{1}}[[1]]In hopes of clarifying rather than confusing, I’m continuing to bold Economic terms.[[1]]
- We are Price Takers: We think we set our own prices, but the Market really dictates Price.
- Every sale we make comes with a “marginal” cost (MC) of selling, in addition to fixed costs.
- Marginal Cost climbs with every sale. Price stays put or goes down.
- We are Willing to Sell as long as our Marginal Cost is less than Price.
- When Marginal Cost is bigger than Price, we are not Willing to Sell.
- We are at the point of maximum Profit when our Marginal Cost is exactly the Price of the good we sold. MC = P.

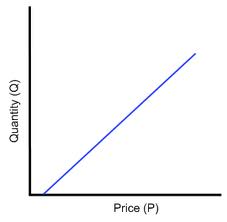
Fig 1. Theoretical Supply Curve for RR and Competitors
If we were to construct one for RR, it would naturally show him selling fewer hearing aids when Price was low and more when Price was high. And, just as with Market Demand Curves, one can combine the individual Supply Curves of all the suppliers in the area and come up with a Market Supply Curve. Figure 1 is a theoretical example of such a Market Supply Curve. Note that some suppliers are willing to sell at very low Market Prices, so they must have lower marginal costs than RR does. Based on RR’s complaint, Costco and the VA are likely suspects. As the Market Price rises, many more suppliers are willing to sell–RR included–because the Price now equals or exceeds their marginal costs.