“The success of the final product of services and hearing aid is dependent much more upon our services than it is upon the product. ” Catherine Palmer PhD
Audiologists and licensed practitioners believe those words, based on years of experience with patients. That’s why most of us do what we do and charge what we charge. The next step in this series of posts is to look at the cost of goods and services as a percentage of revenues.
Last post filled in boxes estimating average costs and net profit for private dispensing practices compared to Internet sellers. That post left several questions dangling:
- Why should consumers fork out that extra $1300-$1500 for dispensing services and support when they can get the product directly for $399?
- What exactly are Audiologists spending that $1300-$1500 gross revenue on?
Pie Anyone?
Plowing through data from individual practices is done to explain and perhaps agree on assumptions underlying the cost and profit averages in last week’s boxes. Pie charts replace boxes because they allow quick and easy individual comparisons between practices and between eras.
It’s no secret to frequent readers that getting numbers from individual practices is tough. Lacking scads of practices pouring in numbers, the data shown below have been derived from a variety of sources, with a stab at “representative” practices. Hearing Economics encourages all readers who own practices to provide their numbers anonymously to a single source ([email protected]). They will be added to the small-but-growing database and all donors will get their own pie charts.
In the Past
Average costs of five dispensing practices in 1977 and nine practices in 1978 are shown in Pies 1 and 2. All 14 practices were retail operations owned and operated by licensed dispensers. Audiologists were only just getting off the ground with hearing aid dispensing and I could find no records of their business operations from those years.
Though nothing but the numbers is known about these practices of the past, it seems safe to say that all or most were sole proprietorships. All were pure play companies with hearing aids as their only line of business. Almost certainly, they did not bill health insurances for services or most product.

- Average Practice Costs 35 Years Ago
In the 1970’s milieu, Cost of Goods consumed the largest part of Total Revenues, followed by Payroll and associated expenses. Net Profit was 17% of Total Revenues, a mark-up of 20%.
In the Present
Expenditures and profits of three hearing aid dispensing practices in 2013 are shown in 3 Pies below. All three practices operate as for-profit corporations, but beyond that, they were selected for diversity:
- Small (C), medium (A) and large (B);
- Two single-office practices (B & C), one multiple office (A);
- A pure play hearing aid practice with minimal insurance billing (C);
- An audiology practice generating 10% of revenues from diagnostics billed to health insurances (A);
- A full-service practice offering most services billable under the Audiology Scope of Practice, generating 30% of revenues from diagnostics of all types, all billed to health insurances (B).

- 2013 Practice Expenditures and Profits
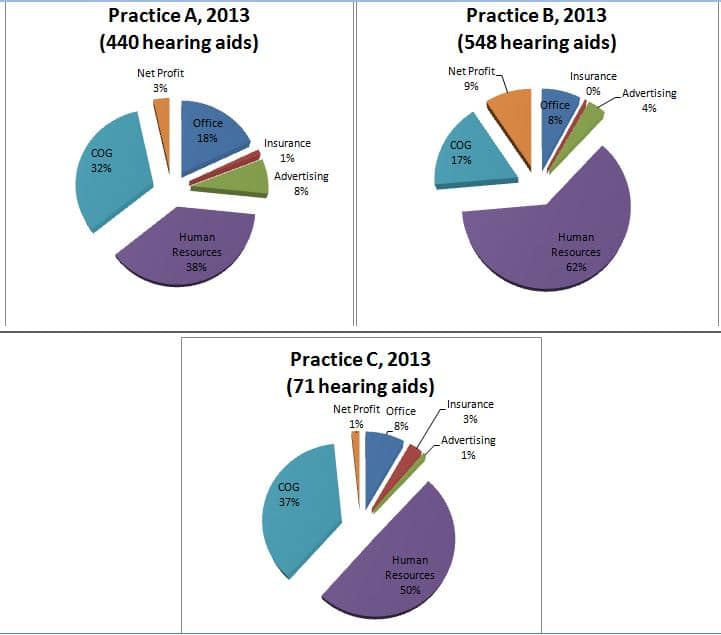
As in the past, COG and employee costs consume the majority of Total Revenues in each practice. Percent spent on COG is lower in Practice B but employee costs are proportionally higher, which is consistent with that practice’s more even mix of diagnostics and hearing aid services.
Net Profits are much smaller than in the 1970s practices, mainly due to higher cost of payroll and related employee expenses nowadays (retirement plans, payroll taxes, health insurance). Reduced Net Profit is also likely due to IRS-driven changes, with owners taking more in wages and less in distributions and draws. For different reasons, both practice size and number of hearing aids sold predict percentage net profitability.
Nobody in the Trenches is Getting Rich
If nothing else strikes you from the pies, the one thing that all five pies make clear is no single practice, now or 35 years ago, is selling scads of hearing aids, in contrast to burgeoning sales in bulk environments such as Costco, Sam’s and WalMart. The numbers I hear whispered, but cannot confirm, for online providers make me gasp, even if they’re off by a factor of 10.
Relatively low sales in service-heavy practices is not a negative. The low sales numbers link directly to the proportionally large percentage of revenues allocated to employment costs, which is the second thing the pies point out. Those costs underwrite all services provided in testing, selling, fitting and maintaining hearing aids, which is Hearing Economics’ answer to one of the two questions that started this post: What exactly are Audiologists spending that $1300-$1500 gross revenue on? According to the Pies, about $1000 to $1200 (80%) goes to hearing aid manufacturers and those on the practices’ payrolls. The 2013 Siemens Benchmark Survey, though not reporting average values, seems to support this view.
The third thing popping out of the pies is that all three types of practices operate with some degree of profit, meaning that they are managed well enough to stay in business in competitive environments with increasing costs of running businesses. That’s good for the owners, though none are reaping enough from their businesses to threaten Bill Gates’s status as richest man in the world. It’s good for those who get services and hearing aids from those practice to know they can rely on the practices to continue providing services and supporting the hearing aid purchases. It’s good for employees, professional and clerical, who can rely on a paycheck and benefits while providing services that help people live better lives.
It’s a win-win-win, at least for those who are willing to run the risks of doing business, those who are willing to pay the price of hearing aids, and those who are willing to gain licensure and show up for work every day.
Next Question
Which leaves the question: Why should consumers fork out that extra $1300-$1500 for dispensing services and support when they can get the product directly for $399? Unfortunately, for many consumers, the data are only beginning to be collected to support Dr. Palmer’s assertion that fitting success depends more on service than product.
Hold the question. It deserves its own post.
(Editor’s note: This is Part 13 in the multi-year Hearing Aid Pricing series. Click here for Part 12).
Title image courtesy of Pumpkin Pie with missing slice by Mark Kelly, Heartspring.net © 2012