Today’s post by frequent contributor Amyn Amlani, PhD, is a fitting salute to David Kirkwood, who retires this week as Editor-in-Chief of HHTM. Kirkwood was first to report MarkeTrak IX findings, a month before they became available to the public. Wayne Staab, HHTM’s new Editor-in-Chief, followed Kirkwood’s lead with two posts analyzing portions of the MarkeTrak report several weeks before its publication.
Continuing that tradition of thoughtful firsts, Dr. Amlani’s post is the first to assess the validity of the MarkeTrak IX adoption rate, compared to the MarkeTrak VIII survey results, based on: 1) units sold and 2) the demand function. His controversial conclusions remind readers that economists– and audiologists like Dr. Amlani who work with basic economic concepts — love data, enjoy arguing their data, embrace critical thinking, and “demand” extensive debate prior to agreeing on interpretation of anything, including MarkeTrak.
Hearing Economics welcomes Dr. Amlani’s application of economic principles introduced in past Econ 202 posts . As a refresher, those posts described Demand Functions and factors that shift Demand. (For more on Dr. Amlani, see his bio below the post.)
————————–
Since 1989, the Hearing Industries Association (HIA) has conducted surveys—named MarkeTrak—that estimate and track the number of Americans who experience hearing difficulties, and those who adopt and use hearing aids.
Historically, MarkeTrak survey results indicate that the percentage of Americans adopting hearing aids, collectively in the private sector and through the Veteran’s Administration, has ranged between 20.4%, in 1981, and 24.6%, in 2008, with the largest growth between surveys being 1.8% (i.e., MarkeTrak IV in 1997 and MarkeTrak V in 2000).
Recently reported findings from MarkeTrak IX survey indicate that the percentage of Americans who adopt hearing aids has increased to 30.2%,{{1}}[[1]]Kirkwood D. (2015, April 15). HHTM Exclusive: Findings from new MarkeTrak study show greater hearing aid use, satisfaction. [[1]] or up 5.4% from 24.6% in 2008 (i.e., MarkeTrak VIII{{2}}[[2]]Kochkin S. (2009). MarkeTrak VIII: 25-year trends in the Hearing Health Market. Hearing Review, 16 (11), 12, 14, 16, 18, 19-20, 22-24, 26, 28, 30-31.[[2]]). This 5.4% increase in adoption rate between surveys has caused speculation within the profession, calling into questioning the validity of the new survey’s results.
Hearing Aid Units Sold
In 2015, 35.8 million Americans are estimated to exhibit some form of hearing difficulty (e.g., reduced audibility due to sensorineural damage, reduced transmission of acoustic signal due to conductive component, single-sided deafness).{{3}}[[3]]op cit., MarkeTrak VIII[[3]] Using the 30.2% adoption rate reported in MarkeTrak IX, the estimated number of US hearing aid users is 10.81 million (i.e., 35.8 million x 30.2%).
The prior survey, MarkeTrak VIII, on the other hand, reported an adoption rate of 24.6%, which yielded an estimated number of 8.81 million hearing aid users (i.e., 35.8 million x 24.6%). The difference in estimated hearing aid users between surveys is 2 million Americans. Interestingly, organic growth in this population grew only by an estimated 1.55 million between 2008 and 2014 (i.e., 35.8 million – 34.25 million).
External Validity versus Face Validity
At face value, the MarkeTrak IX findings seemingly promote that Baby Boomers and late adopters of hearing aid technology are entering the market in herds. This is simply not the case.
If the binaural and monaural purchasing trend of 74% and 26%, respectively, is assumed from MarkeTrak VIII—and applied to the estimated 2 million hearing aid users in MarkeTrak IX—the outcome equates to 1.74 million devices sold between 2008 and 2014 (i.e., 1.48 million binaural; 0.26 million monaural). During this span, however, the HIA reports officially that the number of devices sold increased by a mere .73 million, or 1.01 million fewer than that predicted by the 5.4% increase in adoption rate.
Demand Function
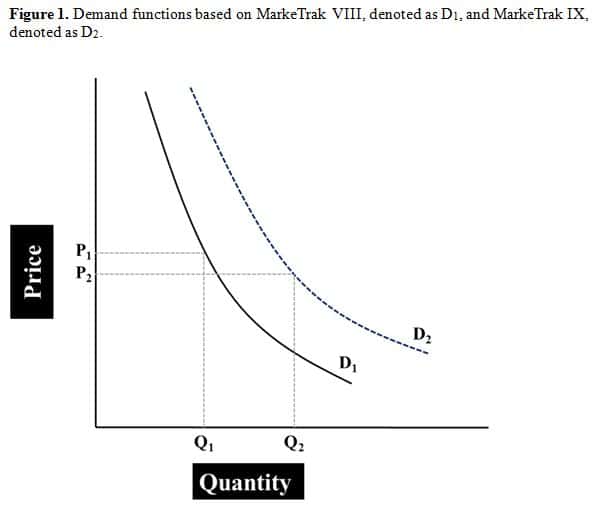
 The demand function—shown in Figure 1—is a sensitive measure of consumer purchasing behavior, determined from quantifying the number of units sold as a function of price for a given product or service. The demand for hearing aids is inelastic, meaning that either decreasing or increasing price has little influence on quantity sold.{{4}}[[4]]Amlani AM. (2010). Will federal subsidies increase the US hearing aid market penetration rate? Audiology Today, 22(2), 40-46. [[4]]
The demand function is always downward sloping, since Quantity Demanded increases with decreasing Price. Thus, its slope is represented by a negative number, for example, -0.45 as of the fourth quarter in 2014, as denoted in Figure 1 by the solid black line (i.e., D1). Between the first quarter in 2008 and the fourth quarter in 2014, the demand function ranged from a low of -0.37 to a high of -0.45.
We previously established that the 30.2% adoption rate boasted by MarkeTrak IX results in an estimated 10.81 million Americans using amplification in 2015. This newly estimated adoption rate results in an inflated increase in demand function by 0.23, suggesting that the demand function ranged from a low of -0.50 to a high of -0.68 between 2008 and 2014. The inflated demand function is depicted in Figure 1 by the dashed blue line (i.e., D2). Note that MarkeTrak IX’s demand function is nearly three times the 0.08 change (i.e., -0.45 – 0.37) in demand function seen in the market during this six-year span.
This increased demand function indicates that the retail cost of hearing aids declined, resulting in a substantial increase in quantity of devices sold. This, again, is simply not the case as evidenced by the mere 0.73 million devices sold, as reported by the HIA. Further, the optimal retail cost of a hearing aid has remained essentially constant since 2005, ranging between $1600 and $1700 per unit.{{5}}[[5]]Amlani AM. (Unpublished).[[5]]
Discussion
The MarkeTrak surveys are an important assessment of the industry and profession. While MarkeTrak IX underwent revisions to the survey itself and the manner in which data was collected, these changes clearly prohibit MarkeTrak IX from being compared with its predecessors.
In the event that comparisons are made, results and conclusions need to be interpreted with extreme caution. It behooves the HIA to consider publishing MarkeTrak IX results under a new name, which would indemnify potential ill-fated future comparisons.
Amyn M. Amlani, Ph.D., is an Associate Professor on the faculty of the Department of Speech and Hearing Sciences, University of North Texas. Dr. Amlani holds the B.A. degree in Communication Disorders from the University of the Pacific, the M.S. degree in Audiology from Purdue University, and the Ph.D. degree in Audiology/Psychoacoustics (minor in Marketing and Supply Chain Management) from Michigan State University. His research interests include the influence of hearing aid technology on speech and music, and economic and marketing trends within the hearing aid industry. E-mail: amlaniam@unt.edu
feature image courtesy of wikiversity


The root problem with MarkeTrak IX is that, as I documented, the online survey study methodology was fatally flawed, backed up by biennial Pew Research Center study on Older Adults and Technology, showing how “seniors continue to lag in tech adoption.”
https://www.pewinternet.org/2014/04/03/older-adults-and-technology-use/
Furthermore, you’re too kind in your words when you conclude,
“…While MarkeTrak IX underwent revisions to the survey itself and the manner in which data was collected, these changes clearly prohibit MarkeTrak IX from being compared with its predecessors.
“In the event that comparisons are made, results and conclusions need to be interpreted with extreme caution…”
Basically, MarkeTrak IX’s results are about as scientifically accurate as an MSNBC or Fox News viewer poll, delivering to their audiences in their respective echo chambers what they want to hear.
Thanks for chiming in, Dan. As usual, you present a strong view, but can you also give us some data to back it up? You know how Hearing Economics loves data.