

Harvey Abrams PhD
“Peeling the Onion” is a monthly column by Harvey Abrams, PhD.
For those of you who have been reading my monthly posts, you know that my focus has been on exploring the differences between the medical and rehabilitative models of audiology. I’m devoting this month’s post, however, to something a little different – a response to Dr. Amyn Amlani’s thoughtful post in the June 2 issue of HHTM, Assessing the Validity of MarkeTrak IX Adoption Rates.
The reason I’m addressing this particular issue here is because I am the co-author, along with Jan Kihm, of a recent article describing the results of the MarkeTrak IX (MT9) survey in the May issue of Hearing Review{{1}}[[1]]Abrams HB, Kihm J. (2015). An introduction to MarkeTrak IX: new baseline for the hearing aid market. Hearing Review, 22(6):16-21.[[1]] published under the auspices of the Better Hearing Institute (BHI).
While this post is not about rehabilitative audiology, the name of my HHTM series, “Peeling the Onion,” is particularly apropos here. As we shall see, there are multiple layers to the issues surrounding the hearing aid adoption rate.
Truth, Validity, and “Damned Statistics”
Dr. Amlani’s argument for questioning the validity of the adoption rate cited in MT9 is the lack of an associated increase in demand (i.e., sales) that would necessarily need to accompany the increase in adoption rate from 24.6% in MarkeTrak VIII to 30.2% in MT9. On the surface, this would appear to be a reasonable argument as it does not appear that the increase in the adoption rate was associated with a similar increase in hearing aid sales from 2008 to 2014.
The flaw in this argument is that it assumes that the adoption rate cited in MarkeTrak VIII is the exact, “true” value. Note I do not suggest that it is not “valid.” In fact, the high quality market research conducted by Sergei Kochkin in his family of MarkeTrak surveys{{2}}[[2]]Kochkin S. (2009). MarkeTrak VIII: 25-year trends in the hearing health market. Hearing Review, 16 (11), 12-31.[[2]] suggests that his calculations and conclusions are, in fact, valid and MT9 followed and built upon its strong research design.
How, then, can something be valid and not necessarily true? Such is the nature of research. Since we can’t test (or in this case, survey) the entire American population, we rely on sampling. Different samples from the same population will yield slightly different estimates and it is rarely possible to start with a perfect “sampling frame” for the entire population. MT9 and MarkeTrak VIII made use of the most feasible list sources available at the time and both used similar processes to ensure the ending sample adequately reflected characteristics of the country.
But, it is important to remind ourselves that the data reported in MarkeTrak VIII and MT9 are “estimates” (statistics), not actual values, and all estimates have sampling error and all processes of data collection have non-sampling error. Equally importantly, there are unique features of the calculations associated with the adoption rate that need to be considered.
Rate Calculations are Sensitive Estimates
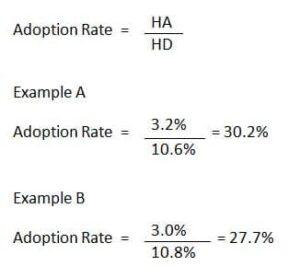
Figure 1. Example of how small changes in the HA and HD rates can yield large differences in the adoption rate. HA=hearing aid ownership rate; HD=hearing difficulty rate.
The hearing aid adoption rate is a very sensitive measure. It is calculated by dividing the percentage of respondents reporting hearing aid ownership by the percentage of respondents reporting hearing difficulties. Very small changes in the numerator and denominator can have a very large effect on the adoption rate.
For example, a 0.2 percentage point decrease in reported ownership coupled with a .2 percentage point increase in reported hearing difficulties, will result in a 2.5 percentage point decrease in the adoption rate (Figure 1). In fact, neither the hearing aid ownership nor the hearing difficulty rate estimate in MT9 changed that much compared to MarkeTrak VIII.
Hearing aid ownership in each survey rounds to the same whole number (2.8 rounds up to 3% in MT9 and 3.2 rounds down to 3% in MarkeTrak VIII) and is just barely large enough for the difference to be significant. Even without rounding, if the MT9 estimate was just slightly lower, the difference between the two estimates would have been within the range of random error.
The hearing difficulty rate is also very similar (10.6 rounds up to 11% in MT9 compared to 11.3% which rounds down to 11% in MarkeTrak VIII).
The amount of change seen here may not even be considered noteworthy in some other industries given that the data is self-reported and all estimates have error ranges that need to be considered.
Different Survey Methodologies
Also of note is that the survey methodology changed between MarkeTrak VIII and MT9. Prior to MT9, all surveys were conducted using a national mail panel. That panel was dissolved prior to MT9 so another method had to be found to conduct the survey. The decision was made to conduct the survey online owing to several advantages associated with online data collection and analysis; furthermore, the EuroTrak surveys{{3}}[[3]]Hougaard S, Ruf S. (2011). EuroTrak I: A consumer survey about hearing aids in Germany, France and the UK. Hearing Review, 18(2):12-28.[[3]] were (are) conducted via online methods allowing for a more valid comparison between US and European data.
Finally, an important difference between MT9 and previous MarkeTrak surveys is that the MT9 respondents were “blinded’ to the purpose of the survey; that is, they were told they were being asked questions about their overall health, not their hearing. It’s possible that this change in approach was responsible for some of the differences found in the reported hearing difficulty rate, if not the hearing aid ownership rate as well. The Abrams and Kihm article acknowledges that there may be some effect based upon the new data collection method and sample source; however, part of our goal is to understand and acknowledge where things align with the past and where they are different and explore reasons behind those (i.e., to understand the data, plan for future waves of the study and ultimately get smarter about our market).
Keep the Name, Improve the Brand
In conclusion, the adoption rate cited in both MarkeTrak VIII and MT9 should be considered valid. This takes us to Dr. Amlani’s suggestion to consider publishing future MarkeTrak results under a new name.
I must respectfully disagree with this suggestion; after all, there have been many refinements to MarkeTrak over its 30 year history and yet we’ve kept the “brand name”. There was not a call to change the NFL brand to something else when the instant replay was used for the first time in 1986 and no one seriously considered changing the MLB brand with the advent of the designated hitter rule in 1973 (well, I could support a brand name change for that one).
More significantly, MT9 is much more than just the adoption rate. The report contains valuable, intuitive data on, and relationships surrounding, hearing aid satisfaction, satisfaction with hearing care providers, the impact of healthcare providers along the patient journey, barriers and facilitators to hearing aid ownership, and the reported impact of wearing and not wearing hearing aids to name just a few of the data sets that comprise the full report.
While I do not advocate a change in the name, BHI has made changes to the brand: they have abandoned the roman numerals, abbreviated MarkeTrak to “MT” and will refer to MT9 in all publications and presentations as “a new baseline.”
This is Part 7 of the Peeling the Onion series. Click here for Part 1, Part 2, Part 3, Part 4, Part 5, Part 6.
Harvey Abrams, PhD, is a principal research audiologist in the hearing aid industry. Dr. Abrams has served in various clinical, research, and administrative capacities in the industry, the Department of Veterans Affairs and the Department of Defense. Dr. Abrams received his master’s and doctoral degrees from the University of Florida. His research has focused on treatment efficacy and improved quality of life associated with audiologic intervention. He has authored and co-authored several recent papers and book chapters and frequently lectures on post-fitting audiologic rehabilitation, outcome measures, health-related quality of life, and evidence-based audiologic practice. Dr. Abrams can be reached at [email protected]