

Last week’s post described a world of audiology in which median wage has increased by $2100/year on average for the last 15 years, yet the audiology workforce has remained flat. This scenario, shown in the feature image above, is alarming. Moreover, it is unusual. Other healthcare professions don’t roll like this. Today’s post looks at labor forces of audiology and other healthcare professions and speculates on what’s up with audiology.
Supply and Demand of Labor Economics
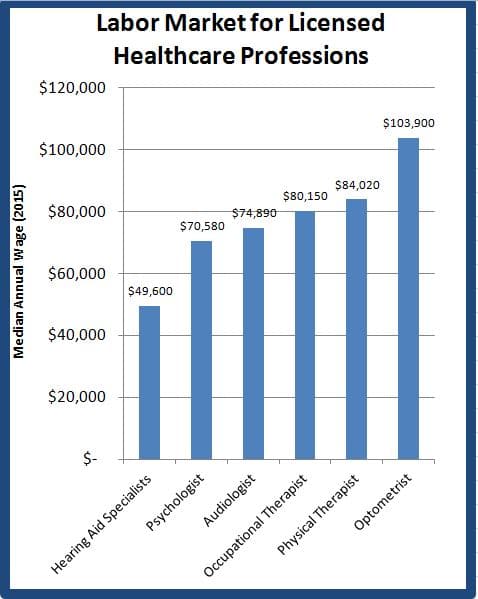
Figure 1. Current median wages for work forces by profession. (Source OES databases, Bureau of Labor Statistics).
It is easier to think of Supply and Demand as “Willingness to Work” (WtW) and “Willingness to Pay” (WtP) functions when thinking about the labor market. Consider Figure 1 for healthcare workers’ 2015 median wages. In each profession, 50% of its labor force is Willing to Work at or below the median wage indicated. The other 50% is Unwilling to Work unless the wage is that amount or higher. WtW determines Supply of labor. Supply is a positive-sloped function because workers will work more for higher wages.
Figure 1’s data reflect employed individuals, meaning that their employers have demonstrated a Willingness to Pay according to these schedules: some pay higher, some pay lower, but the median wage is most commonly paid. WtP determines Demand for labor. Demand is a negatively sloped function because employers will hire more workers at lower wages.
Thus, for purposes of the present discussion, the median wage can be thought of as the equilibrium point (aka market clearing point) of Supply and Demand for each profession. Note that WtP is not that of the consumer, but of the employer. It is possible to have a temporary consumer shortage, as forecast by Windmill and Freeman, if employers’ WtP is less than the wage needed to expand a work force
Figure 1 shows that in 2015, the market clearing point for audiologists is $5,000, $10,000 and $30,000 less in annual wage, respectively, than the clearing points for physical therapists, occupational therapists and optometrists. All other things being equal, it is probably fair to say that people in those three professions chose them over audiology at least in part because they were unwilling to work for the lower audiology wage.
On the Supply Side, How Much Is Enough?
All other things are not equal, including opportunity costs of education in different professions. College education time, including four years of undergraduate education, for audiologists is usually 8 years, equivalent to the education years of optometrists. Opportunity cost is less for PTs, who graduate in seven years, and lower yet for OTs, who only need six years of college. By contrast, psychologists are the lowest paid doctoral level professionals in Fig 1 but require the most education time (8-12 years). The value of other factors (e.g., graduate school acceptance rate, job satisfaction, intellectual stimulation, client relationships, academic prestige, employment opportunities) may trump other opportunity cost considerations for some who chose counseling fields such as psychology or audiology.1
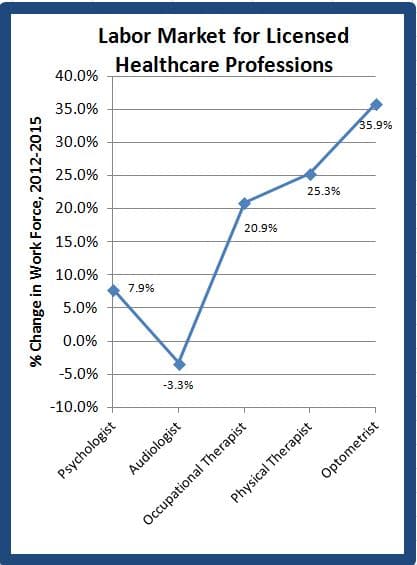
Fig 2. Percentage change in professional work forces from 2012-2015. (Source OES databases, Bureau of Labor Statistics).
Despite consistent annual wage gains and a fair-to-middling median wage for audiologists, it is clear from the data in Figure 2 that opportunity costs for audiology lack appeal for many. For whatever their reasons, workers in healthcare consistently eschew audiology in favor of careers in other licensed healthcare professions. Of the five career examples shown, none have a negative labor growth rate except audiology.
Figures 1 and 2 give hints about “How much would be enough?” on the Supply side. For instance:
- Audiology vs Occupational Therapy: OT is a Masters level profession, but it requires two years less spent on education and offers $5000 more in annual income. Would that combination entice more people to a career in Audiology,or would the almost-inevitable loss of “doctor” after one’s name pose too high an opportunity cost?
- Audiology vs Physical Therapy: Both are doctoring professions so the calculation is more straight-forward. One year less education and $10K more in median wage might be enough, holding other factors constant.
- Audiology vs Optometry: Boosting audiology’s median annual wage by $30K would bring wage equivalency to these two doctoring professions that each require 8 years schooling.
On the Demand Side, How Low Can You Go?
This discussion of the audiology labor market has not taken substitutes into account. The “Ask an Audiologist” campaign requires consumers to prefer audiologists over all other available choices. But demand for substitute choices increases when audiologists become scarce or too costly, which is why shortages are temporary as the market seeks out means of reaching equilibrium. Windmill and Freeman warned of economic substitutes:
“Unless strategies are put in place to enable audiology to meet the demand, it is possible that alternative delivery systems for hearing care could evolve.”
Hearing aid specialists (see Figure 1) are one such labor substitute. They’re Willing to Work for substantially less than other licensed healthcare professionals and their numbers are growing. Next post in this series will look at overlapping Supply and Demand for audiologists and hearing aid specialists in today’s market.
Footnotes
1I know of no data to support this speculation, but it is a good topic for student research and results might prove useful in backing up the “Demand an Audiologist” value statement.
References
Bureau of Labor Statistics. Occupational employment statistics, OES databases (2000 through May 2015). United States Department of Labor.
Windmill IM & Freeman BA. Demand for audiology services: 30-yr projections and impact on academic programs. JAAA 24:407-416 (2013).