

Editor’s Note: Business decision-making requires analytics to steer decisions towards profitability. Over the years, the hearing healthcare market has utilized analytics called key performance indicators (KPIs) as their compass when making business decisions. Given the rapid changes occurring in the hearing healthcare arena, we are learning that some KPIs, which were once considered as barometers to financial gain, are not as sensitive as previously believed.
April’s guest blogger is Mr. Dan Quall. Mr. Quall is an industry leader and serves as the Director of Managed Care for Fuel Medical Group. Mr. Quall, who has nearly four decades of experience in the hearing healthcare arena, has studied and continues to assess the importance and predictability of various KPIs and their impact on a business’ profit and loss. This month’s blog is part 1 of a multi-part series that provides the reader with insight into the metric of revenue per hour (RPH).
Introduction
Dan Quall, M.S.
The business of being a provider of hearing services is changing. Today’s hearing healthcare professionals are faced with numerous issues that are impacting their profit and loss statements. The accessibility of hearing aids through Big Box stores, third-party contracts, and over-the-counter is changing the way professionals are offering products and services.
As the business model changes, so should the way we benchmark and measure business outcomes. The standard Key Performance Indicators (KPI) of gross revenue, units sold, and average sale price (ASP)—that historically quantified a business’ success—may no longer provide the necessary financial information to make critical business decisions.
Revenue Per Hour (RPH) as a New Financial Indicator
Given the current industry trend toward tighter margins, unbundling, and fee for service models, a financial indicator that professionals should add to their financial analytic toolbox of KPIs is the measure of Revenue Per Hour (RPH).
To understand the relevance of RPH, an example of this KPI is applied to a traditional “bundled” hearing aid sale. To make the RPH calculation two data values are required:
- Service vs. Time
- Gross Margin
Service vs. Time Model
The service vs. time model, shown in Table 1, was developed to understand the total clinic hours spent by a clinician with a typical patient purchasing hearing aids and subsequent services for a five-year period. The following assumptions were made for this model:
- First-time wearer of product
- Binaural purchase
- The model represents an “average” or “typical” treatment plan (that is, some patients require more visits, some fewer)
- A binaural set of hearing aids will require 3 repairs within a five-year period. One repair each year after year 2 (based on manufacturer repair rates)
- Repair costs and margins for the out of warranty repairs are not included in the calculation
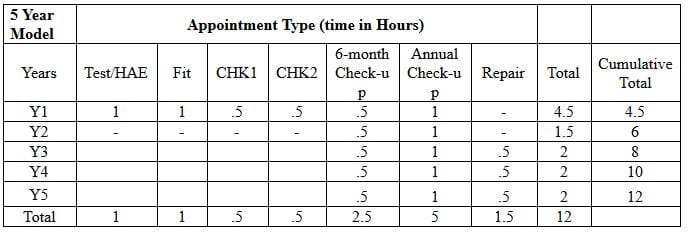
Table 1
Over the five-year span, the model shows:
-a total of 17 patient visits with 12 hours of clinician time spent with the patient;
-2 appointments were directly related to the dispensing of the product; and
-15 appointments were provided as follow-up and continuing service
(Note: the model shown was validated as “typical” for a first-time wearer of hearing aids with more than 30 business owners in a continuing education class by the author in 2015. Additionally, Amplifon2, in a presentation to the FDA in 2017, reported an average 15.1 visits for follow-up and check-up appointments (excluding the dispensing appointment) based on analysis of 21,881 patients receiving products in 2010 and receiving continuing services through 2015.)
Gross Margin
Next, financial analysis must be completed for a bundled sale to obtain the gross margin (not the gross revenue) per fitting. For our purposes, gross margin was derived from the 2017 survey data from Phonak3, where results provided revealed the median bundled hearing aid sale to be $2,297 monaural, or $4,594 binaural. Assuming a wholesale cost of goods of $758 per unit—or $1516 for two units, based on 33% cost of goods sold (use your specific business’ data)—the gross margin for this set of hearing aids equals $3,078.
Calculating RPH
The RPH for this treatment plan, given new hearing aids are not purchased before five years, would be as follows:
Gross Margin, $3,078, divided by clinical hours (12) = $257/hour or $257 RPH.
Clinical Application
What does this calculation mean? When a bundled hearing aid treatment plan is dispensed at $4,594, and the patient follows the typical follow-up and treatment plan, the business will have realized gross margin of $257 for each hour spent with the patient.
Part 2 of this series will examine how the revenue per hour calculation can be used to make business decisions in your clinic.
References
- Phonak reference: https://www.audiologist.org/about/ada-news-archive/1797-phonak-benchmarking-survey
- Amplifon/FDA: https://www.ftc.gov/system/files/documents/public_comments/2017/05/00125-140808.pdf
- Phonak, commissioned Customer Care Measurement and Consulting, LLC (CCMC), a nationwide survey of hearing professionals, 2017 Practice Performance Comparison – US, Audiologist Channel Report.
*featured image courtesy healthcaremanagementdegree.net