

 Many of us in the discipline of hearing speak frequently about the adverse effect of noise on hearing – often assuming that farm workers are very susceptible to hearing loss because of the noise levels of their machinery. But, I wonder. In fact, I have felt for years that farm workers currently may have no greater hearing loss than the general population. Of course, I could be proven wrong – something that has happened to me more often than I like to admit.
For a few years I have considered using a dosimeter during the annual wheat harvest at my family’s farm in Kansas to determine how much noise one is exposed to now that substantial noise reduction features are currently employed on farm equipment. Perhaps the greatest of these are the enclosed cabs. However, it is not only the noise reduction designs of the cab that have helped. Moving of exhaust, engines, etc., farther from the operator have reduced noise levels as well. What follows is my unscientific investigation into this issue during this year’s wheat harvest.
So, off to Kansas I go to “assist” with the harvest, trying not to wreck any of the equipment entrusted to my care. And, this is an example of getting in one’s Internet post even when on the road – or should I say in the field (literally). Why does this make me think of the definition of a farmer – a man outstanding in his field?
The Farm
- Harvest: Western Kansas, late June 2014, harvest of 2400 acres of mostly dry land winter wheat.
- Combine: John Deere 9770 STS with Shelbourne 32 foot stripper header. Combine cab noise level not indicated by manufacturer.
- Tractor: John Deere 8310R pulling J&M 875 bushel grain cart. Tractor cab level rated at 73 dB(A).
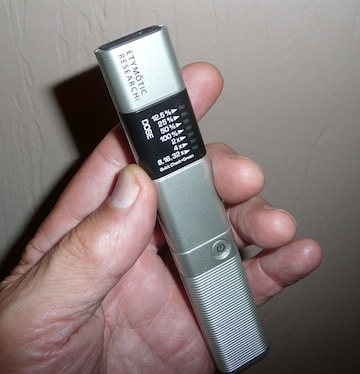
Figure 1. Dosimeter used for this measurement activity – Etymotic Research ER-200D Personal Noise Dosimeter.
Noise Measurement Equipment
An Etymotic Research ER-200D Personal Noise Dosimeter was used to make this measurement (Figure 1). This is an inexpensive, easy-to-use device that provides a good estimate of noise dose and alerts the user to the risk of over-exposure. It does not measure impulse noise, but that was no problem because wheat-harvesting equipment has no impulse noise (nor does most other harvesting crop machinery). In fact, other types of crop harvests use similar machinery, consisting mostly of a harvester, truck, and tractor. The dosimeter measures average risk, not individual risk. Any of the multitudes of dosimeters could have been used. It just happened that this is what I had with me at the time. (Doesn’t everybody carry a dosimeter with them?)
Then and Now
Perhaps it is best for non-farm readers to view the differences between machinery used in the past with that used today (Figure 2) so they can understand why noise exposure is much less today. https://s98.photobucket.com/user/1206SWMO/media/Shows/Achille-7.jpg.html
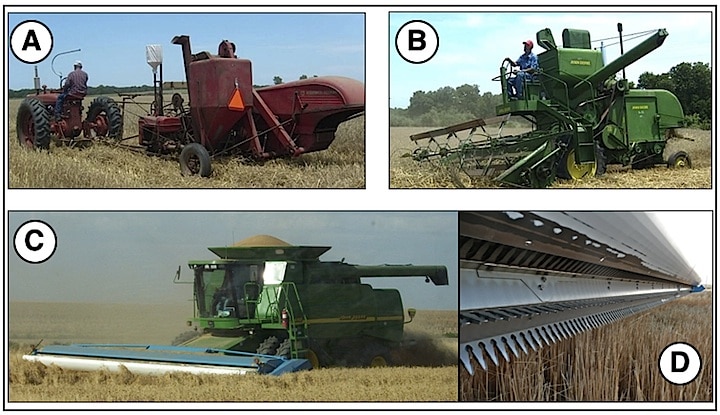
Figure 2. A pull combine is shown in A. The tractor exhaust is in front of, and at ear level, with the operator. B shows a self-propelled combine with no enclosed cab. C shows s self-propelled combine with an extensive cab designed for comfort and noise reduction. Two types of headers are used: the reel-type shown in B (granted, a very old and short header as compared to the wide ones used today, but used to show the reel arrangement, where the wheat stalk is cut low), and D, a stripper header that takes only the grain heads, leaving the straw uncut. Headers today run up to 45 feet in width.
Hi Ho, Hi Ho, It’s Off To Work We Go (oops, mixing songs – I knew that)
Results are plotted for a single day for the combine and the tractor pulling the grain cart, even though the same routine occurs on a number of days. Data are from a single day’s measurement to avoid any down time due to rain or repairs to equipment. Also, the number of harvesting days can vary dramatically. Usual cutting is about 12 to 14 hours per day, depending often on the moisture content of the wheat (dampness often occurs later at night. And, yes, harvesting is done at night as well as daytime).
Dosimeter Settings
The dosimeter was set to “Normal Mode.” This setting obtains dose values every 220 msec, summed over a 3.75-minute interval, and saved in non-volatile memory every 3.75 minutes (16 times per hour). The read-out can be shown in days, hours, minutes, or seconds, and it can measure data for 16 hours, 3 days, 5 days, or 7 days. The dose is stored in the device memory, and downloaded to a PC. The exchange rate was 3 dB, the criterion level at 85 dB, and the threshold level at 75 dB. These determine how noise dose is defined and computed. Frequency weighting was A, and slow response. The internal microphone was used.
Background on Dose % Measurement
The measurement of interest is that of noise exposure, and expressed as Dose %. This is a combination of the amount of sound and the amount of exposure time. While sound levels may fluctuate over time, noise dose never decreases over time; it either remains stable or increases. Think of 100% dose as the exposure limit for an entire day; 200% as double the exposure limit for a day or two days’ worth of noise exposure; 400% as four times the limit or four days’ worth of noise exposure, etc.
The risk of hearing impairment grows with increasing noise dose. The limits of safe exposure to high sound levels are not absolute, since people differ in their degree of susceptibility to noise-induced hearing loss. Dose limits are based on average susceptibility. A small fraction of the population is more susceptible than average, and, for these people, a 100% dose may be enough noise exposure to cause hearing loss over time. Likewise, a small fraction of the population is less susceptible than average, and these people may be able to tolerate noise exposure exceeding 100% without developing significant hearing problems. Most people will fall somewhere between the two extremes.
Allowable noise dose estimates follow one of two Standards: (1) the National Institute for Occupational Safety and Health (NIOSH) Criteria for a Recommended Standard (NIOSH, 1998), or (2) the Occupational Safety and Health Administration (OSHA) Occupational Noise Standard (OSHA, 1983). There is a significant difference between the Standards relative to the amount of noise exposure causing hearing loss. NIOSH is more conservative and hence, more protective of hearing than OSHA.
For example:
- NIOSH 100% Dose = 85 dB for 8 hrs or 88 dB for 4 hrs.
- OSHA 100% Dose = 90 dB for 8 hrs or 95 dB for 4 hrs. NIOSH measurements were recorded.
Measurement Results – An Oink Oink Here, and an Oink Oink There…..
Oink #1 = Combine
Real-time noise accumulation data related to Dose % for the combine operator is shown in Figure 3. No data could be found for the cab noise rating for this combine. Results show that the LEQ (A-weighted continuous equivalent sound level) noise level in the cab during combine operation was at about 83 dB. The dosimeter was operable for 11.11 hours. This is based on a run-time clock, not a real-time clock.
Some explanation of the real-time data is in order. The initial 3/4 hour included the pickup ride to the field, pickup shut off and exited, general noise in the area, and then the drop until just past hour 2, when the dosimeter was in the combine cab (combine not running), and representing the time of servicing the combine before starting operations. The Dose % continues to increase until hour 8 when time was taken to check the combine, inspect, and clean the feeder housing and separator. Figure 4 provides the summary data taken from the dosimeter for the combine cab measurement. The 95.1% final dose suggests this exposure to be a risk factor, and that hearing protection could conservatively be considered by the combine operator. The noise level was fairly constant regardless of the combine speed.
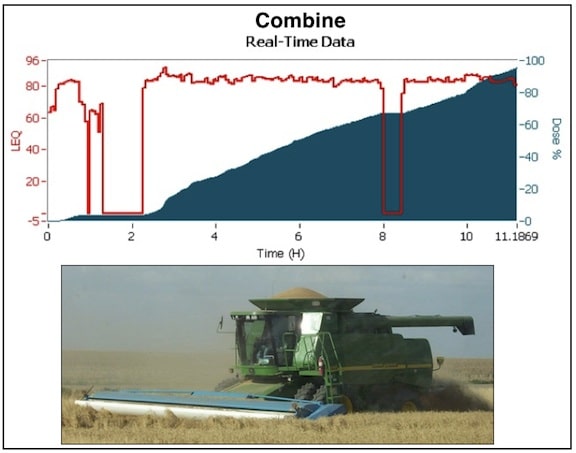
Figure 3. Real-time noise accumulation data from within the combine cab.
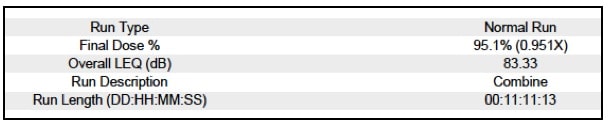
Figure 4. An explanation of the data from the combine as described in the text.
Oink #2 = Tractor pulling grain cart
Figure 5 shows the real time, LEQ, and Dose % for the tractor grain cart cab. The Dose % of 10.1 suggests no risk factor of hearing loss resulting, and no hearing protection is needed. The real-time data (9.43 hours) is significantly more variable than for the combine cab. This reflects the much different activity of the grain cart. While the tractor is not shut down, even when waiting to unload the combine or to dump on the grain truck, its noise level changes when in the idle mode (waiting), operating under different speeds (depending on what is being done at the time), and activation of the power take-off when the grain auger is unloading to the grain truck. However, there were four specific times that the tractor was shut off for a short time, as indicated by the drops of the red real-time line. The LEQ of 74.23 is close to the cab noise rated level of 73 dB(A).
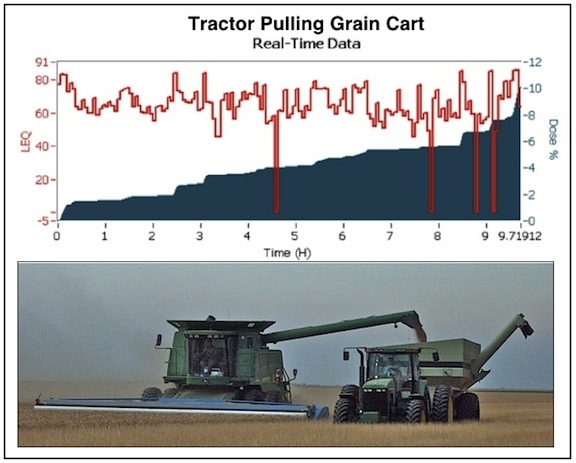
Figure 5. Unloading on the go so there is no stopping of the harvesting process. The grain cart is able to get to the combine regardless of where it is in the field. When the grain cart is full, it is driven to the grain trucks and unloaded.
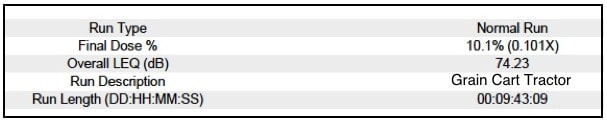
Figure 6. Run type, final dose %, and overall LEQ (dB) experienced by the grain cart driver (of the tractor) during this 9.43 hour exposure.
Final Thoughts
The combine cab noise levels are higher than that of the tractor cab. This should not be surprising based on the activity that occurs in the combine (header, feeder, separator, engine, and discharge noise) versus primarily the engine noise of the tractor. The tractor cab seems to manage the noise levels quite well, and indicates that no noise protection is required. The combine cab, considering all the different noise levels underneath it, also manages the noise levels well. At a Dose % of 95.1, the risk factor is approximately that of a daily dose and suggests conservatively (NIOSH) that hearing protection is needed, particularly when harvest occurs over many days.
Based on NIOSH criteria:
- 50 – 99% = Risk Factor of 1/2 or more of daily dose. Hearing protection needed (conservatively)
- <12.5% = no risk of hearing loss. No hearing protection needed.
Old MacDonald Today
Old MacDonald may have had a farm, but it is hard to imagine that he ever envisioned that seen in Figure 7.
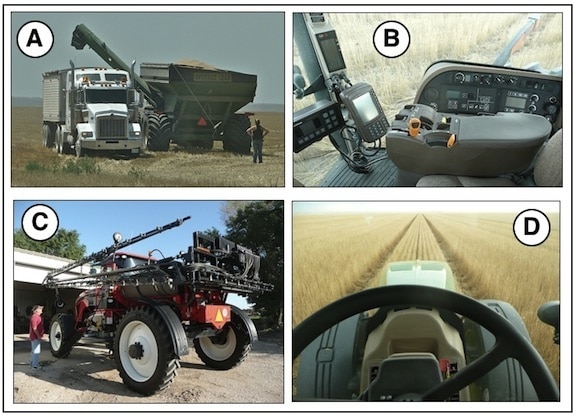
Figure 7. Modern day farm equipment used at one time or another on a wheat crop. A is a grain cart being unloaded to a semi truck and trailer. B shows the controls of a tractor. C is a self-propelled sprayer for weed control (extends to 100 feet), and D is illustrative of the straight-line impact of self-steering (hands free) farm equipment controlled by GPS. Combines, tractors, sprayers, and even some pulled implements are available with GPS control.


