Hearing Aid Delay – What the Data Tells Us
In a recent post related to hearing aid delay, I reported that what I had found suggested that current digital hearing aids had delays that were considered acceptable, being less than about 10 msec.
But, since the data reported was taken a number of years ago, I commented that I had found no recently collected data on digital hearing aid group delay times.
Review
This delay in digital hearing aids is the time involved from the initial stimulus reception by the hearing aid until it is processed and delivered to the hearing aid speaker/receiver. It is also more commonly referred to as group delay. As more features are added to the hearing aid, the total group delay can increase (Herbig and Chalupper, 2010).
For example, group delay can increase with a greater number of channels, more advanced digital noise reduction and feedback systems, etc. (My apologies to Herbig and Chalupper for inadvertently omitting their reference in my previously published hearing aid delay post). Depending on the amount of delay, the result could be audible, objectionable, or even result in auditory confusion.
To the Rescue
A timely response to my failure to find recent data on hearing aid group delay was sent to me by Dr. Joshua Alexander of Purdue University.
He mentioned that he spends a week each year in his Hearing Aids II class teaching the students about hearing aid delay and the effects of filter complexity, algorithms, etc. And, for the past seven years, his students have had an assignment in which they use the Frye Hearing Aid Analyzer to measure delay and current drain for various hearing aids that have been programmed with all of their advanced signal processing features turned “On” and then “Off.”

Dr. Joshua Alexander*
Dr. Alexander agreed to allow these data to be published in this post. We thank Dr. Alexander (Alexander, 2016) for his willingness to share these data, and to the students who collected the data.
Hearing Aid Delay Data
The results collected over these years are shown in Figures 1 through 9. A caveat is that these are student-collected data based on only a few runs, so an occasional errant outlier in the data can be found. Additionally, not all hearing aids were covered and the number of manufacturers’ hearing aids measured from year to year was not constant, nor were they the same models (models change), but the data represents a good sample of what has been generally available.
The data for 2009 contain measurements for the features “On” condition only (Figure 1), but the data for subsequent years show measurements for both the “On” and “Off” features conditions. To the advantage of delay in hearing aids, based on these measurements, it appears as if the delay has remained well under 10 msec. for the years under test.
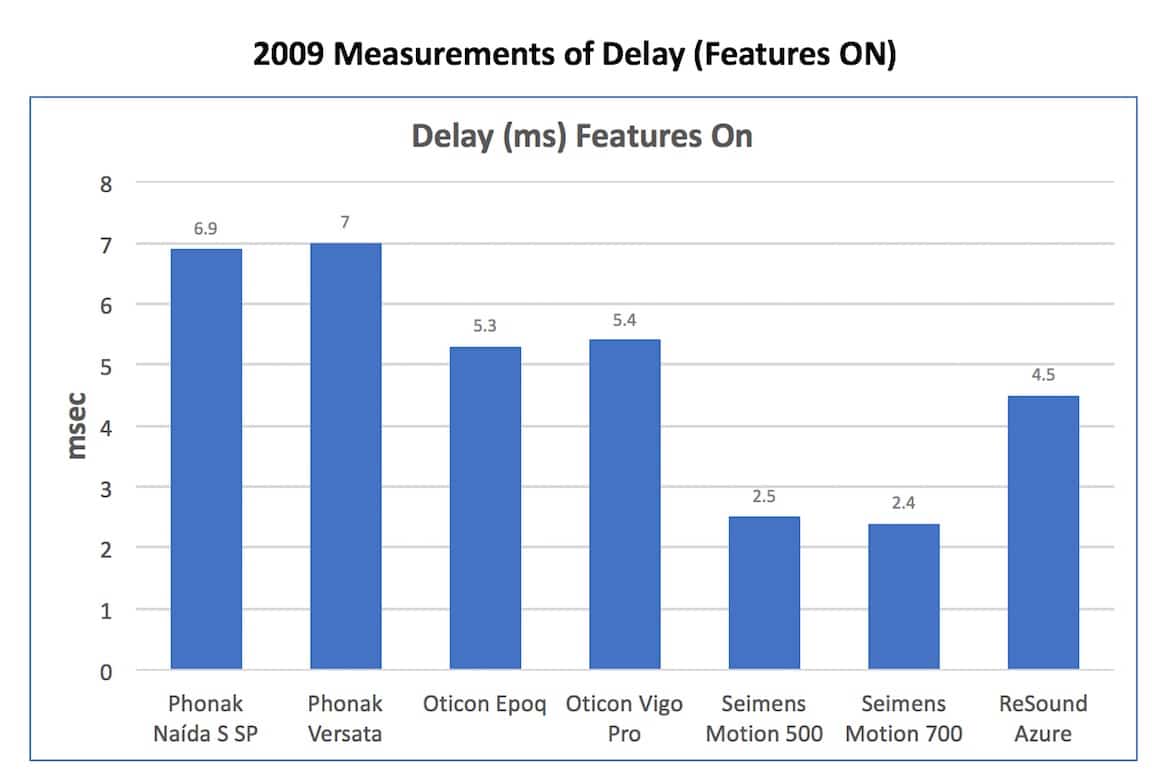
Figure 1. Delay measurements in msec. with the hearing aid having its features turned “ON” for seven hearing aids in 2009.
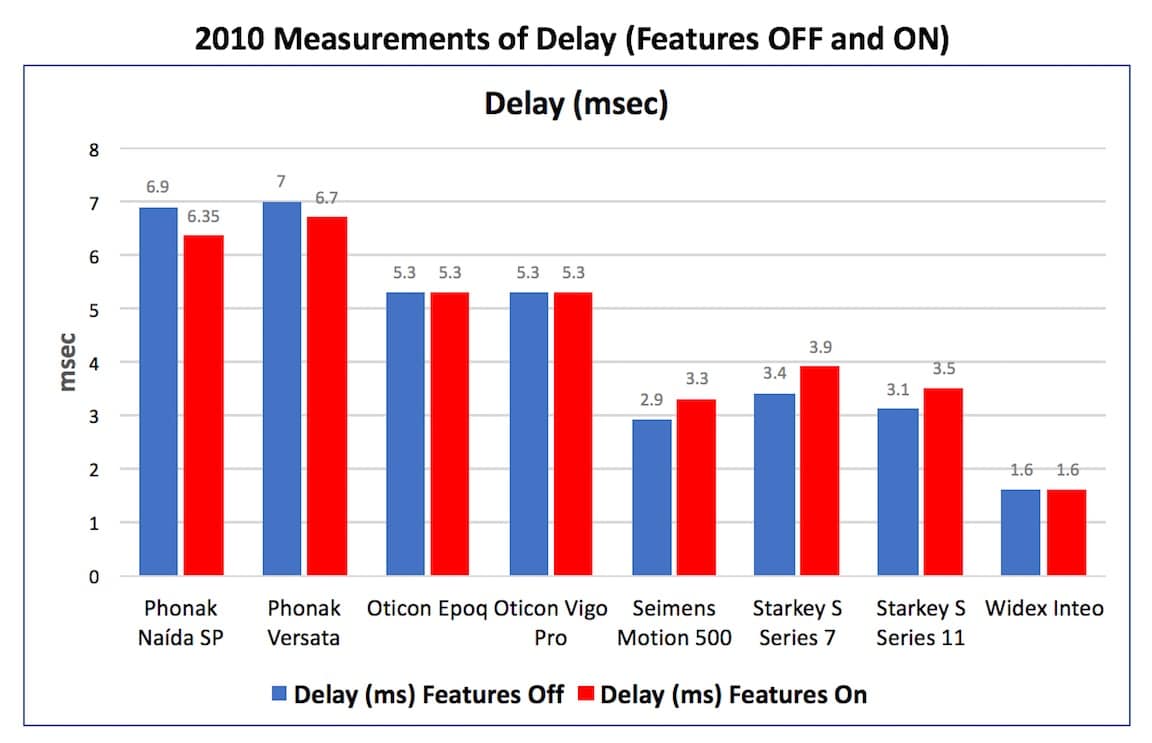
Figure 2. Delay measurements in msec. with the hearing aid having its features turned “OFF” and then “ON” for eight hearing aids in 2010.
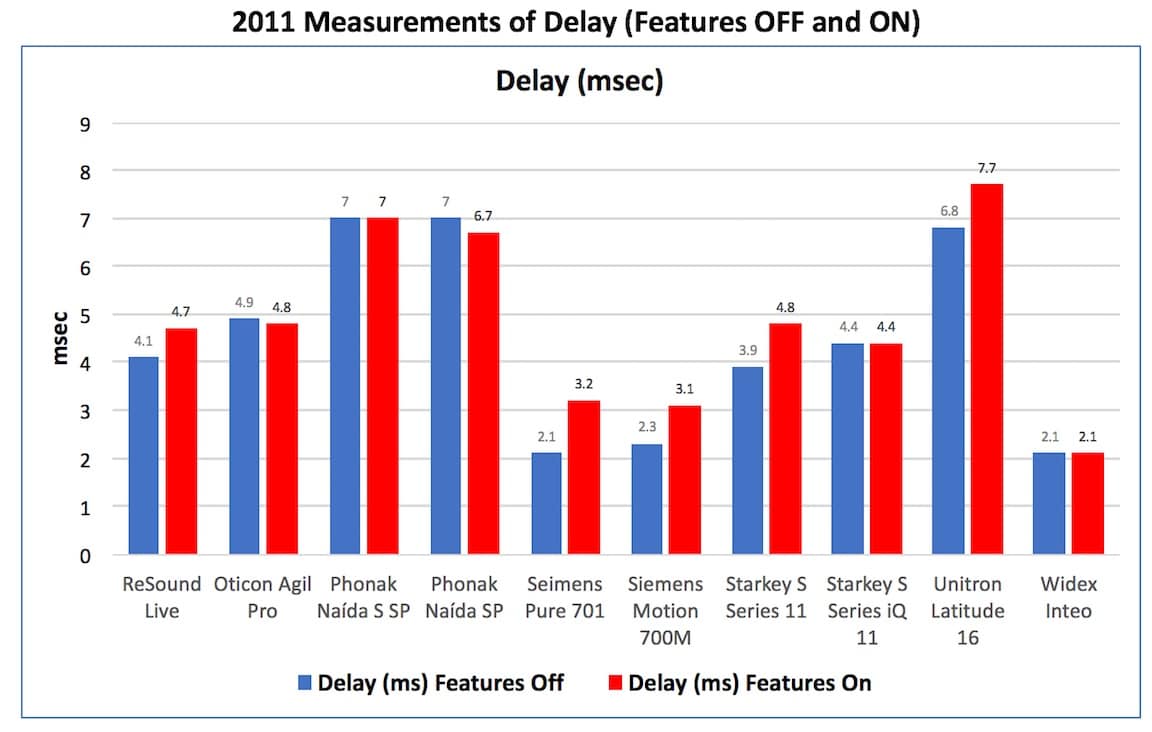
Figure 3. Delay measurements in msec. with the hearing aid having its features turned “OFF” and then “ON” for ten hearing aids in 2011.
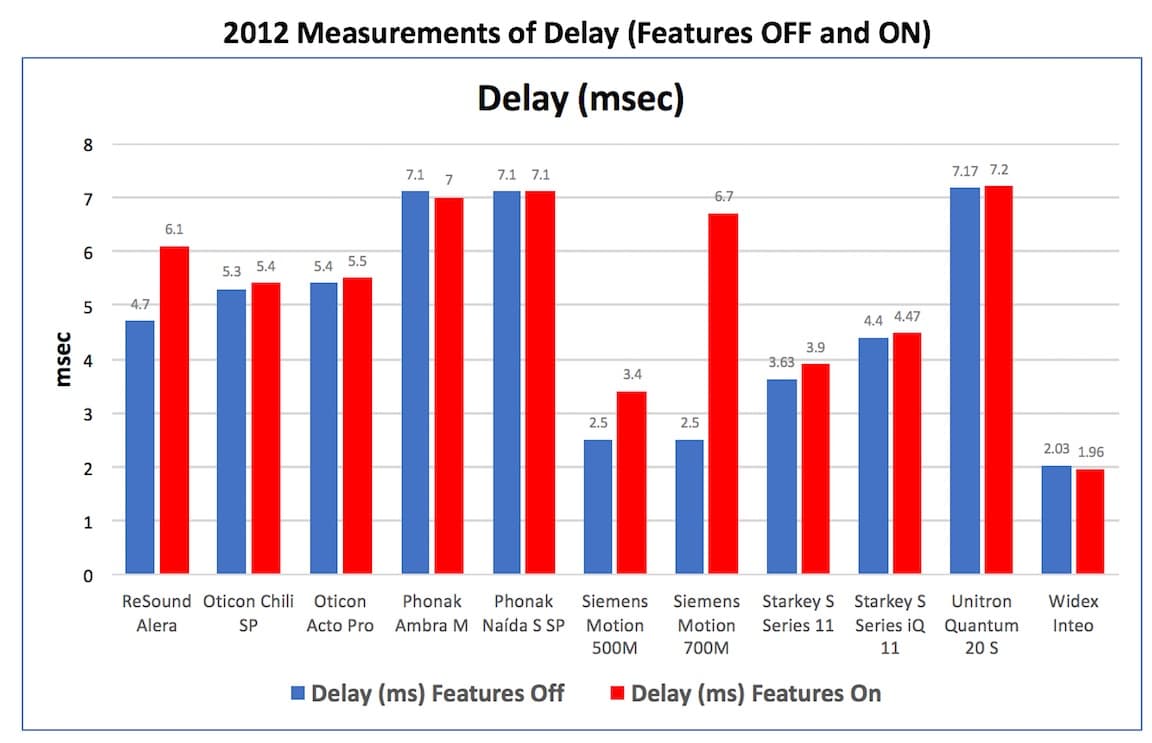
Figure 4. Delay measurements in msec. with the hearing aid having its features turned “OFF” and then “ON” for eleven hearing aids in 2012.
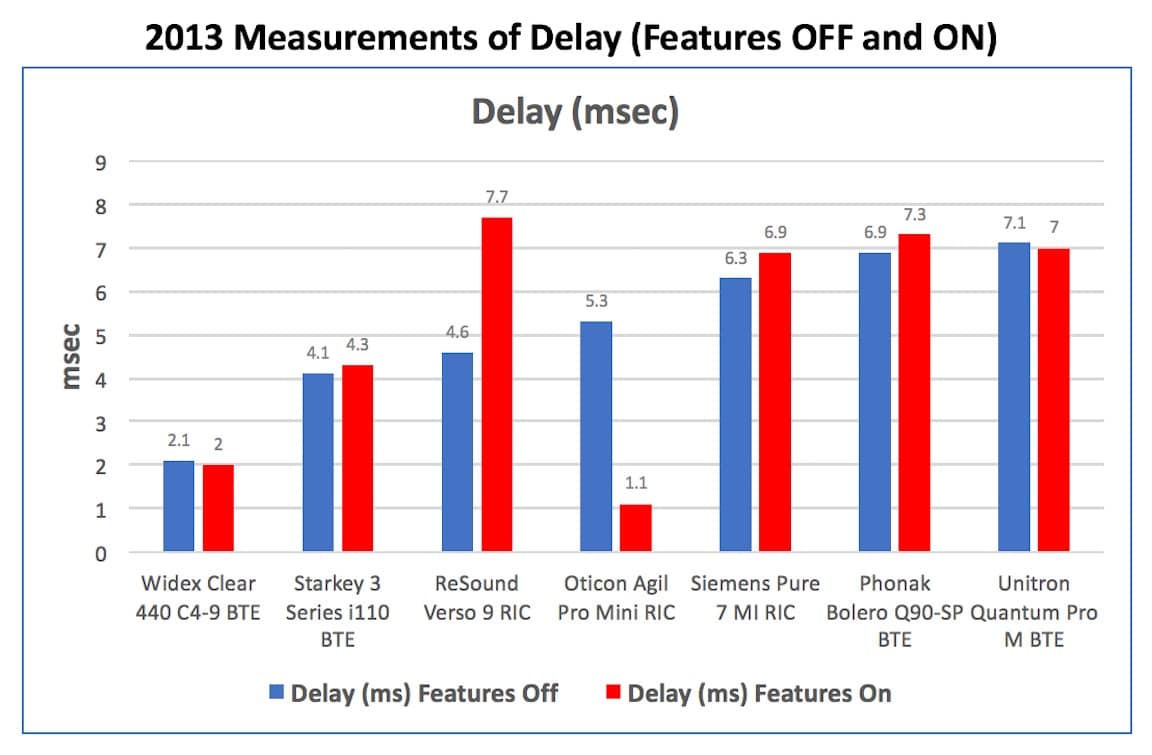
Figure 5. Delay measurements in msec. with the hearing aid having its features turned “OFF” and then “ON” for seven hearing aids in 2013.
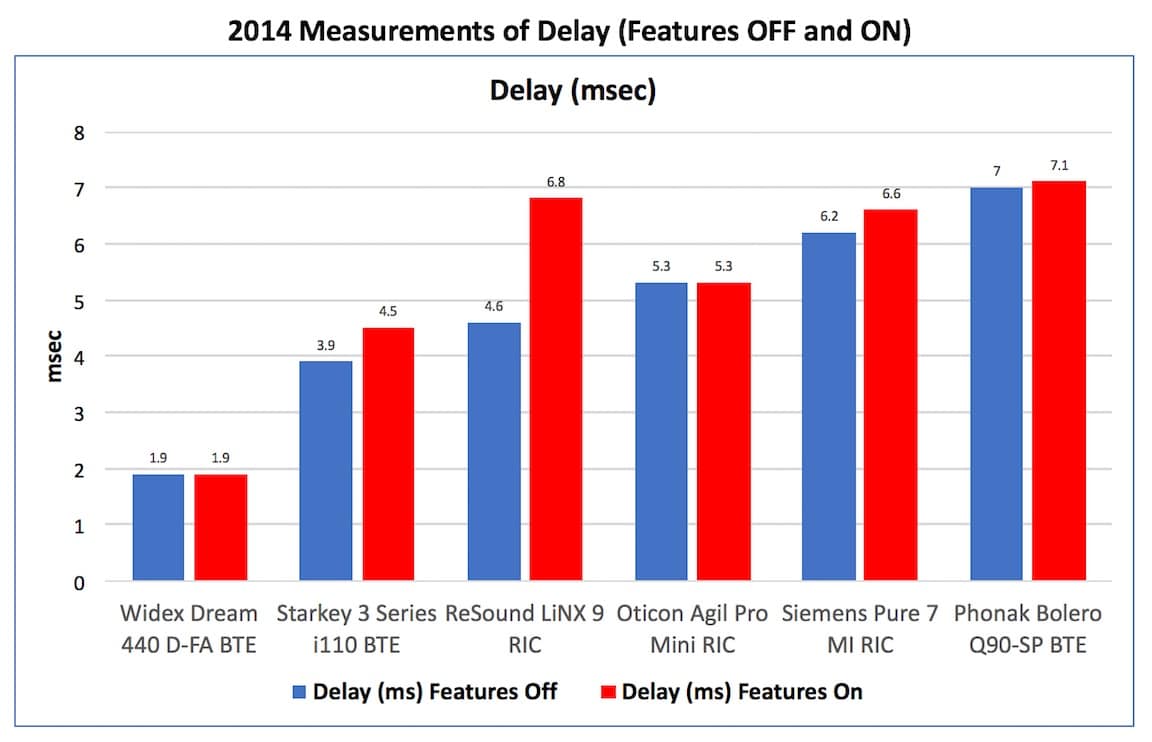
Figure 6. Delay measurements in msec. with the hearing aid having its features turned “OFF” and then “ON” for six hearing aids in 2014.
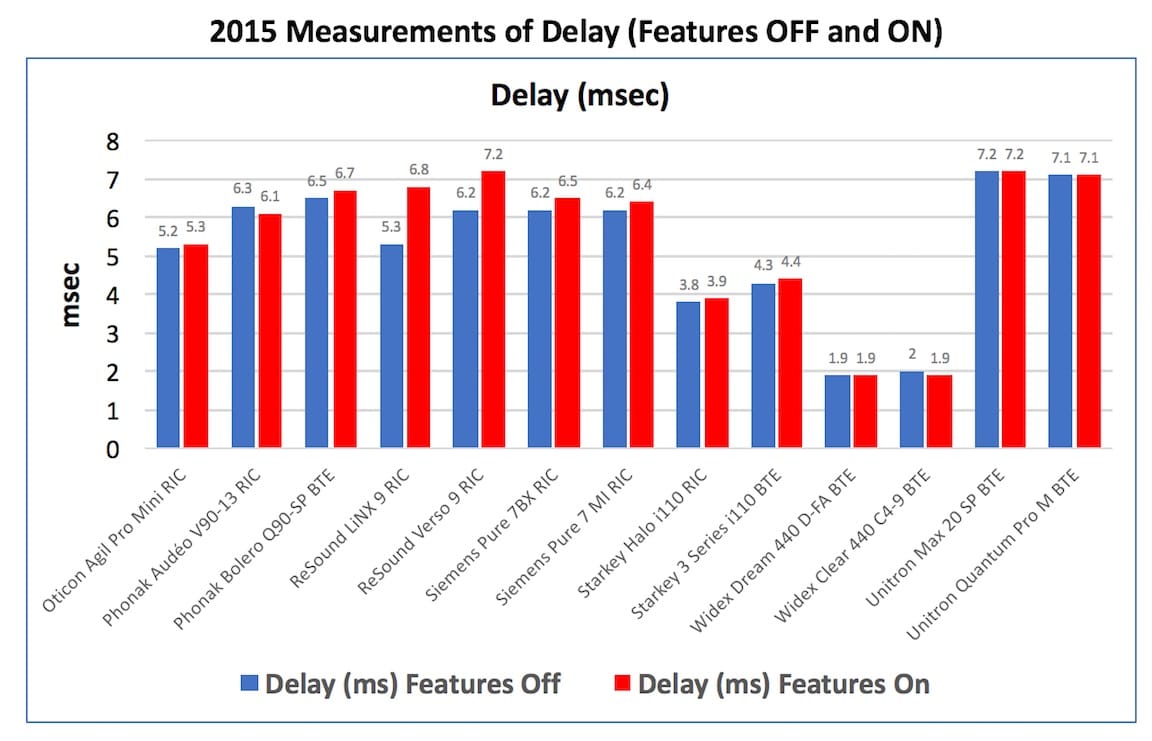
Figure 7. Delay measurements in msec. with the hearing aid having its features turned “OFF” and then “ON” for thirteen hearing aids in 2015.
Figures 1 Through 7 General Comments
A cursory observation of hearing aid delay from 2009 through 2015 (Figures 1 through 7) tends to suggest:
- Delay has remained under 10 msec.
- Manufacturers seem to be fairly consistent in their delay times – either longer or shorter than the competition.
- Delay with features “ON” appears to be longer than with features “OFF.”
- It appears that delay times have been increasing slightly from 2009 through 2015.
Accumulated Delay Data
Averaging the data from Figures 2 through 7 (not often the best thing to do) resulted in Figures 8 and 9. Figure 1 data for 2009 was not included because the data was for the features “On” condition only. Figure 8 shows that the average hearing aid delay across hearing aids was consistently, although marginally, longer in each year for the test condition when the hearing aid features were activated. Figure 9 shows the accumulated average differences in delay over the time period from 2010 through 2015.
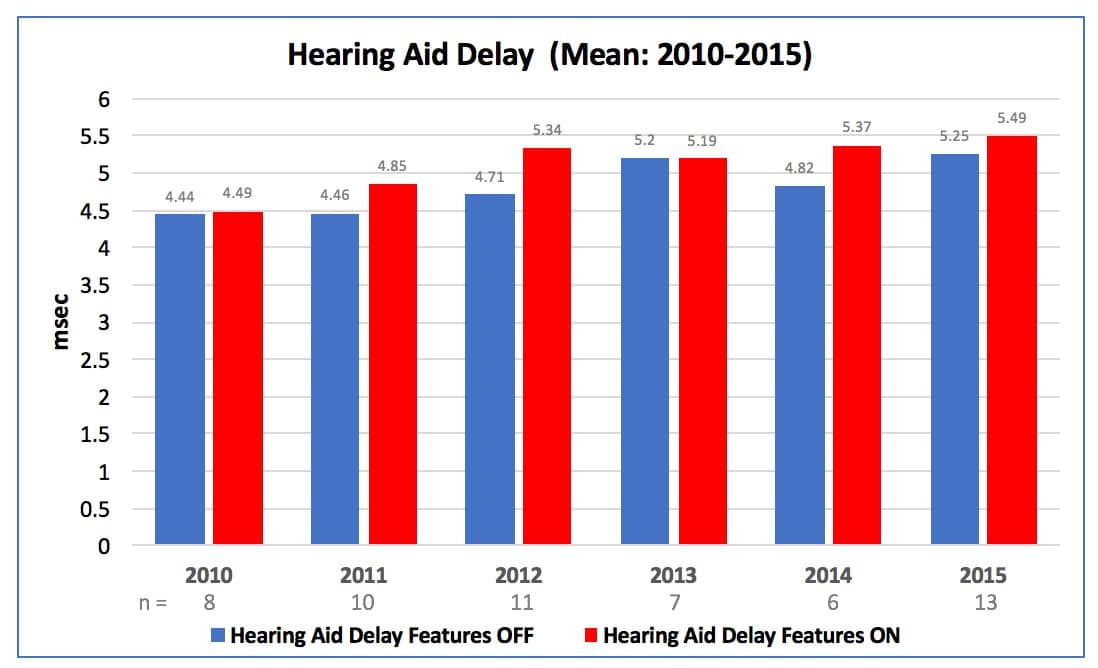
Figure 8. Average hearing aid delay in msec. the hearing aids tested from 2010 through 2015, with the delay for “Features OFF” in blue and “Features ON” in red.
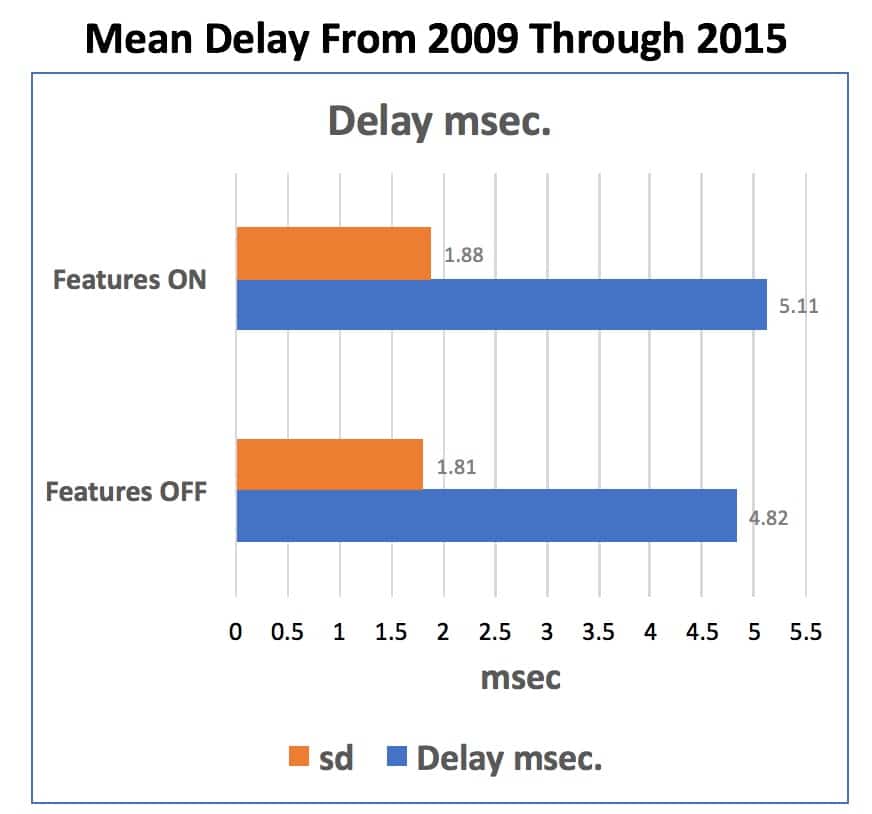
Figure 9. Mean/average delay accumulated measurements in msec. with the hearing aid having its features turned “OFF” and then “ON” for the hearing aids measured from 2010 through 2015. (sd = standard deviation).
Comments
It should come as no surprise that hearing aid group delay seems to be increasing slightly in more recent years because advanced and more complex digital processing algorithms being used generally require increased time to perform.
Not shown in this post, and definitely of more interest, is what happens to current drain from having features enabled and features disabled. This has an impact on battery life, and will be the topic of the next post, based on using the same hearing aids but measuring their current drain with the features turned “Off” and then “On” covering the same years.
*Joshua M. Alexander is an assistant professor at Purdue University in West Lafayette, Indiana. He received his Ph.D. in Audiology (psychoacoustics) and post-doctoral training in speech perception at the University of Wisconsin- Madison. Prior to Purdue, he completed clinical and post-doctoral fellowships at Boys Town National Research Hospital in Omaha, Nebraska. His research interests focus on auditory processes contributing to speech perception deficits in hearing-impaired listeners and signal processing to overcome them. Ongoing projects in his Experimental Amplification Research (EAR) laboratory include work on frequency-lowering techniques, wide dynamic range compression, and speech enhancement techniques.
References
Alexander, J. (2016). Personal communication. Purdue University.
Herbig, R. and Chalupper, J. (2010). Acceptable processing delay in digital hearing aids, Hearing Review, Vol. 17(1):28-31.
About the author
Wayne Staab, PhD, is an internationally recognized authority in hearing aids. As President of Dr. Wayne J. Staab and Associates, he is engaged in consulting, research, development, manufacturing, education, and marketing projects related to hearing. His professional career has included University teaching, hearing clinic work, hearing aid company management and sales, and extensive work with engineering in developing and bringing new technology and products to the discipline of hearing. This varied background allows him to couple manufacturing and business with the science of acoustics to bring innovative developments and insights to our discipline. Dr. Staab has authored numerous books, chapters, and articles related to hearing aids and their fitting, and is an internationally-requested presenter. He is a past President and past Executive Director of the American Auditory Society and a retired Fellow of the International Collegium of Rehabilitative Audiology.
**this piece has been updated for clarity. It originally published on February 2, 2016




In figure 5, the bar graph for the Oticon Agil Pro Mini RIC, seems to be a misprint. Looking at the rest of the graphs, it is highly unlikely that the delay with the features on is much less than the delay with the features off.