
Large scale data from a number of epidemiological studies is yielding valuable insights into incidence and prevalence of hearing loss in different cohorts. As just one example, the National Health and Nutrition Examination Survey (NHANES) study data tells us that 93% of white men in the 60-69 age group have high frequency hearing loss and 43% have hearing loss in low and mid-frequencies. That is just a peek at all that this wealth of longitudinal data is beginning to reveal about hearing loss, gender, aging, and a plethora of other health-related variables.
In recent years, studies have begun to plumb the epidemiological data for lifestyle links to hearing loss. Exercise, social activities, work environments, and food choices are examples of lifestyle choices that could influence hearing health. Information on results of such research can be immediate importance to consumers and hearing healthcare providers, as well as other stakeholders, if is shown that improvements are possible as a part of daily life. As one study puts it:
“Diet is one of the few modifiable risk factors for age-related hearing loss.” (Gopinath et al 2011)
Antioxidants and vitamins, ingested via food or supplements, are obvious candidates for investigation. The data are mountainous and the challenge of controlling covariance among a large number of variables demands careful study design and statistical analyses. Different types of subjects in different numbers for different lengths of time comprise different data sets, which adds to the challenge. Finally, hearing evaluation measurements were not top in the minds of those who designed baseline measures when the studies were initiated decades ago.
As a result, the data may be (partially) in, but the results are just beginning to give us some idea of how or if vitamins and antioxidants are important to our hearing. Today’s and next week’s posts look at what has come out of the studies to date.
Quick Statistics Primer
It’s not surprising that complex study designs and analyses test our ability to understand their findings and conclusions. Most audiologists, in good company with most readers in general, do not have years of education in statistics. It’s easier to interpret study findings if you have a good handle on definitions and terms which are common to researchers but not so commonly bandied about in clinical practices.
Here are a few reminders that may prove helpful in reading the summary studies in the next sections.
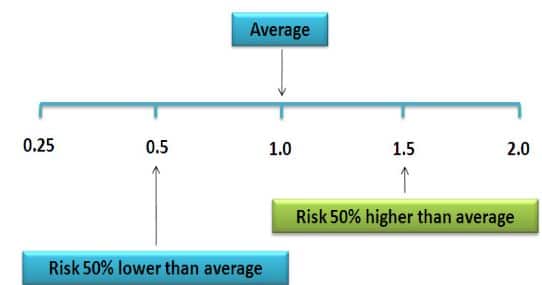
Figure 1. Relative Risk illustration (from nutridesk.com)
- Incidence: This is a proportion or percentage figure that is a measure of the risk of developing hearing loss in a time interval specified by the study.
- Prevalence: Another proportion or percentage, this figure states the portion of hearing loss in the study population at a given time.
- Odds Ratio (OR): This states the odds that hearing loss occurs with an intervention (i.e., vitamin intake) compared to the odds of it occurring without the intervention (i.e., no vitamin). An OR = 1 means the odds are even and the intervention has no effect. A positive OR means the risk is heightened by the intervention; a negative OR means the risk is lowered. NOTE: Hi or low odds do not state or imply causality.
- Risk Ratio (RR): Also called the Relative Risk. RR states the odds of hearing loss in one intervention group compared to other intervention groups over time. RR = 1 means even odds, same as OR.
- Hazard Ratio (HR): This is the same measure as RR but only at one point in time. HR is a measure of “instantaneous risk”, not cumulative risk over a time interval like OR and RR. Like OR and RR, HR = 1 means even odds.
- Confidence Level (CL) The calculated probability that any of the ratios above are true. It’s needed because all data come from samples of an entire population. Large samples are better for estimating than small samples, but even large samples contain some degree of uncertainty. A 95% CL means that there is a 95% probability that the HR, RR or OR is correctly reflecting the true population and is not in error.
- Confidence Interval (CI): The Confidence Interval (CI) states the upper and lower value of the estimate. When the CL is 95%, the CI extends from 2.5% to 97.5% of the measurements.
Three Studies of Hearing Loss and Dietary Risk Factors
Next week, we’ll compile some basic descriptors for the designs and findings of three important studies:
- Health Professionals Follow-up Study (Shargorodsky et al, 2010)
- Blue Mountains Hearing Study (Gopinath et al, 2011)
- Conservation of Hearing Study (Curhan et al, 2015)
Although the studies are monumental, they vary in scope, goals, length, etc., and each has limitations. But in the aggregate, they lend support to the idea that vitamin antioxidants have some influence on hearing loss which deserves further study.
References
Agrawal Y et al. Prevalence of hearing loss and differences by demographic characteristics among US adults: data from the National Health and Nutrition Examination Survey, 1999–2004. Arch Intern Med. 2008;168:1522–1530.
Curhan SG et al. Carotenoids, vitamin A, vitamin C, vitamin E, and folate and risk of self-reported hearing loss in women. Am J Clin Nutr. 2015 Nov; 102(5): 1167–1175. Published online 2015 Sep 9. doi: 10.3945/ajcn.115.109314 PMCID: PMC4625586
Gopinath B et al. Dietary antioxidant intake is associated with the prevalence but not incidence of age-related hearing loss. J Nutr Health Aging 2011;15:896–900.
Shargorodsky J et al. A prospective study of vitamin intake and the risk of hearing loss in men. Otolaryngol Head Neck Surg. 2010 Feb; 142(2): 231–236. doi: 10.1016/j.otohns.2009.10.049 PMCID: PMC2853884 NIHMSID: NIHMS180764
feature images from Inside Tracker