

The Affordable Care Act’s Healthcare was reviewed, state-by-state, last week. This week brings another table (below) of dubious data collected with sincere effort to try to estimate the ACA’s impact on Audiologists.
Requests for updates and corrections last week went unheeded. Logical explanations, in order of probability, are 1) nobody reads this column except Harvey Abrams, 2) few readers understand the healthcare provisions of the act, and 3) the data were correct. Logical proofs follow:
- Dr Abrams requested permission to use last week’s Table 1 in an upcoming presentation. No one else commented or requested permissions. Ergo, no one reads this column except Harvey Abrams.
- The Onion’s headline: “Man Who Understands 8% Of Obamacare Vigorously Defends It From Man Who Understands 5%.” According to the article, both men understood 3% in post-discussion. Ergo, few readers understand the healthcare act.
- If data go undisputed, they are not proved incorrect. Ergo, they are correct.
Perhaps such logic underlies reports of the Present Situation, in which the US Government is closed, even the USS Enterprise can’t make it through the online health insurance portal, and fewer than 1/3 of medical groups are agreeing to participate in the healthcare system. Economists are tough and don’t let trifles such as these stand in their way. Hearing Economics is made of the same stuff and forged ahead this week, slicing through the Present Situation.
The Portal
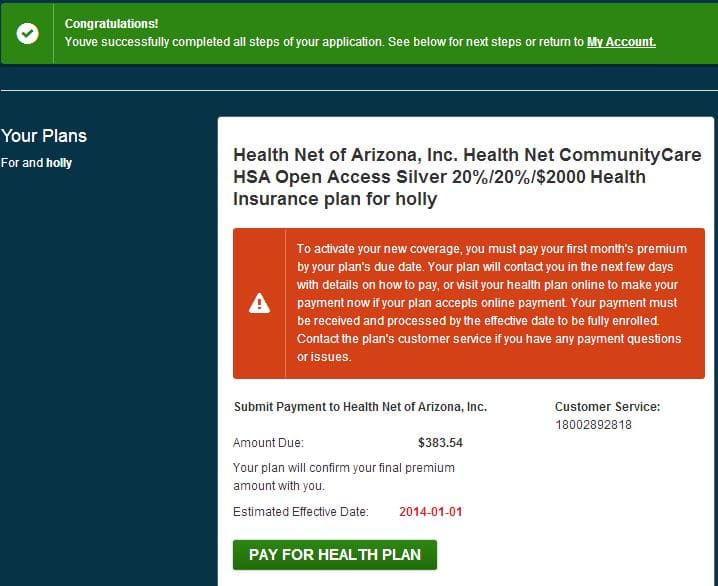
Figure 1. Proof of Portal Passing.
Despite claims to the contrary, it IS possible to self-enroll for health insurance via the online portal. I did it (see Figure), it only took a week, and it answered 3 questions: How hard was it? Could I get a better insurance rate? Did Arizona enrollees seriously qualify for a “one hearing aid per year” benefit? The answers were: Not Bad, Yes, and Yes.
The portal is amazing but it’s easy to see why it remains a work in progress. Those poor software engineers and managers have done a fantastic job of navigating HIPAA, political, insurance, and state specific obstacles, not to mention a government shutdown, inadequate funding, too many chiefs, and direction that was too little and too late.
Put yourself in the following scenario and ask yourself why the code writers didn’t commit group seppuku weeks ago:
As late as the last week of September, officials were still … debating whether consumers should be required to register and create password-protected accounts before they could shop for health plans.
Holy Cow. Medicare took a decade to get online and roll out HIPAA requirements. The Portal People tried to create something as big as Medicare, state-by-state, in a matter of months. When this is over, they all deserve medals, time off, and raises.
How Many Hearing Aids is That?
The insurance actuaries probably know, but they’re not sharing and I don’t know anyone else who can answer that question. Not every state, in fact NO state except Arizona, has the 1 hearing aid per year benefit built into the state plan. That makes Arizona a good place to start playing around with data and making wild predictions.
The first question is “How many additional people will be covered in each state?” Last week’s table gave percentages but Audiologists and Economists like to know “percentage of what?” Ditto for medical groups, which may explain why so few have signed up as providers so far.
Real numbers are hard to come by, given the Present Situation of a closed Census Bureau. But why let lack of data stand in the way? The following Table uses secondary sources to try to estimate numbers of insured and numbers of insured with hearing loss. If everyone who qualifies in Arizona enrolls and avails themselves of benefits, well over 100,000 hearing aids could be dispensed annually in Arizona. Thassa lotta hearing aids. We’ll see how many end up getting dispensed, at what prices, and by whom.
Economically, hearing aid subsidies beget supply-side shocks which beget increased utilization rates which beget shifts in the Demand Curve, altogether shifting equilibrium. It’s not a free market, but it’s a market that’s shifting rightward — more quantity at lower prices.
Let me know where I’ve miscalculated or missed the boat entirely. Otherwise, logic will say that these data are correct, which I strongly doubt. Please join in — Harvey shouldn’t have to do this alone! (Editorial note: big tables are tricky in wordpress. If the table doesn’t look right, try a different browser — Chrome, Mozilla, etc).
| State |
% Insured[i] |
Labor Force (ages 16-64)[ii] | Estimated # of Uninsured[iii] | Estimated # Hearing Loss[iv] |
| AL | 18.8 |
2,158,000 |
405,704 |
81,141 |
| AK | 21.8 |
365,800 |
79,744 |
15,949 |
| AZ | 20.5 |
3,024,900 |
620,105 |
124,021 |
| AR | 21.9 |
1,350,400 |
295,738 |
59,148 |
| CA | 23.2 |
18,479,600 |
4,287,267 |
857,453 |
| CO | 17.1 |
2,740,400 |
468,608 |
93,722 |
| CN | 9.9 |
1,877,400 |
185,863 |
37,173 |
| DE | 9.6 |
444,200 |
42,643 |
8,529 |
| DC | 7.5 |
363,900 |
27,293 |
5,459 |
| FL | 22.8 |
9,377,100 |
2,137,979 |
427,596 |
| GA | 22.5 |
4,806,500 |
1,081,463 |
216,293 |
| HI | 10.5 |
649,200 |
68,166 |
13,633 |
| ID | 17.2 |
772,800 |
132,922 |
26,584 |
| IL | 17.2 |
6,587,800 |
1,133,102 |
226,620 |
| IN | 16.7 |
3,141,600 |
524,647 |
104,929 |
| IA | 11.8 |
1,634,400 |
192,859 |
38,572 |
| KS | 14.6 |
1,486,400 |
217,014 |
43,403 |
| KY | 19.8 |
2,077,500 |
411,345 |
82,269 |
| LA | 24 |
2,081,600 |
499,584 |
99,917 |
| ME | 14.8 |
705,500 |
104,414 |
20,883 |
| MD | 12.3 |
3,124,000 |
384,252 |
76,850 |
| MA | 4.5 |
3,471,900 |
156,236 |
31,247 |
| MI | 15.4 |
4,653,000 |
716,562 |
143,312 |
| MN | 11.5 |
2,965,600 |
341,044 |
68,209 |
| MS | 21.7 |
1,333,600 |
289,391 |
57,878 |
| MO | 16.4 |
2,988,500 |
490,114 |
98,023 |
| MT | 16.9 |
508,400 |
85,920 |
17,184 |
| NE | 15.9 |
1,021,300 |
162,387 |
32,477 |
| NV | 23.3 |
1,376,300 |
320,678 |
64,136 |
| NH | 13.6 |
742,100 |
100,926 |
20,185 |
| NJ | 15.2 |
4,597,700 |
698,850 |
139,770 |
| NM | 20.1 |
935,500 |
188,036 |
37,607 |
| NY | 13 |
9,581,000 |
1,245,530 |
249,106 |
| NC | 19.4 |
4,723,500 |
916,359 |
183,272 |
| ND | 13.8 |
392,800 |
54,206 |
10,841 |
| OH | 14.7 |
5,733,600 |
842,839 |
168,568 |
| OK | 21.4 |
1,803,900 |
386,035 |
77,207 |
| OR | 17.6 |
1,957,800 |
344,573 |
68,915 |
| PA | 11.9 |
6,493,100 |
772,679 |
154,536 |
| PR | 6.7 |
1,209,700 |
81,050 |
16,210 |
| RI | 15.2 |
561,200 |
85,302 |
17,060 |
| SC | 20.5 |
2,164,500 |
443,723 |
88,745 |
| SD | 14.4 |
445,200 |
64,109 |
12,822 |
| TN | 17.6 |
3,108,400 |
547,078 |
109,416 |
| TX | 28.8 |
12,596,100 |
3,627,677 |
725,535 |
| UT | 15.7 |
1,354,000 |
212,578 |
42,516 |
| VT | 9.2 |
355,900 |
32,743 |
6,549 |
| VA | 14.7 |
4,203,400 |
617,900 |
123,580 |
| WA | 16.9 |
3,476,400 |
587,512 |
117,502 |
| WV | 19 |
806,000 |
153,140 |
30,628 |
| WI | 11.8 |
3,046,400 |
359,475 |
71,895 |
| WY | 21.3 |
305,900 |
65,157 |
13,031 |
[i] 2011 US Census data as reported in AARP Bulletin Oct 2013, p 32.
[iii]Calculated as ( % Uninsured * Labor Force)/100
[iv] rough estimate from Linn data & Kochkin MarkeTrak report