

Is There a Real Percentage Change in Hearing Aid Market Penetration rates?

This week’s post continues a discussion of hearing aid market penetration. This was not the intended topic, but after reading last week’s presentation, some readers challenged Figure 1 of that post, even though the overall message was not challenged – that market penetration is not as good as most hearing professionals had hoped.
Fifty Years and Counting
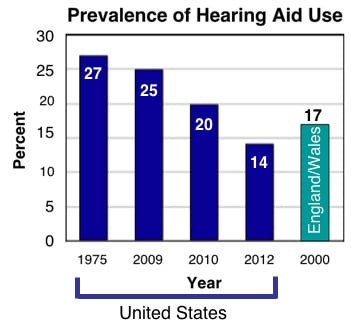
Figure 1. Prevalence of hearing aid use in the United States, where hearing aids are mostly purchased with private funds, compared with that of England/Wales, where the National Health Service provides hearing aids free. The 1975 figure of 27% refers to the hearing aid industry estimates of 1975, based on the author’s notes from that period. The 2009 estimate of 25% is taken from MarkeTrak VIII{{1}}[[1]]Kochkin S. (2009) MarkeTrak VIII: 25 Year Trends in the Hearing Health Market. Hearing Review 16:11[[1]]. The 20% estimate in 2010 is from Amlani{{2}}[[2]]Amlani AM. (2010) Will Federal Subsidies Increase the U.S. Hearing Aid Market Penetration Rate. Audiology Today 22(3):40-46[[2]], and the 2012 estimate of 14.2% is from Lin{{3}}[[3]]Lin, F. Hearing loss in older adults: a public health perspective, Presentation given at the ADA Meeting, 2014, Las Vegas, NV, 2014, referenced to Arch Int Med. 2012[[3]]. The 2000 estimates for England and Wales were from Lin’s Las Vegas, NV 2014 presentation given at the ADA Meeting, 2014, references a NICE Report of 2000.
The question of hearing aid market penetration has been a topic of discussion for at least the past fifty years. Some look at the number, suggesting that the industry has a long way to go, while others view whatever number is advanced as misleading and discouraging to the general public. It all depends on how one chooses to portray the data. This post will not resolve this issue and will leave the final word to those who have much more time to spend on it.
Figure 1 (repeated from last week’s post) provides the image leading to this challenge. Based on data taken from the reports referenced, it appeared that the market penetration was declining rather than increasing. It has been argued that these data do not represent comparable statistical scrutiny. That may be true, but my point was that market penetration seems not to be increasing significantly, regardless of efforts made in at least the past fifty years to educate professionals and consumers about the importance of good hearing. These same efforts continue today, and some have advocated a renewed and refocused continuation of these efforts as the path to improved market penetration in the future.
For comparison purposes, Figure 2 shows market penetration from pre-2000 MarkeTrak Reports, which show a decreasing trend line. The market penetration data in Figure 2 refers only to households as defined by the U.S. Bureau of Census, that is, people living in a single-family home, duplex, apartment, condominium, mobile home, etc. People living in institutions were not surveyed (residents of nursing homes, retirement homes, mental hospitals, prisons, college dormitories, and the military).
“The trend showed a steadily declining market penetration since 1984, with the number of hearing aid owners remaining unchanged at 5.6 million, while hearing-impaired non-users increased by 1.1 million, to 21.7 million people”{{4}}[[4]]Kochkin, S. MarkeTrak V (1999), The Hearing Journal, January, Vol. 52, No. 1, p. 37[[4]].
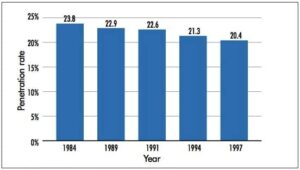
Figure 2. Hearing aid market penetration (1984-1997), MarkeTrak V, Kochkin, S.

Figure 3. Hearing aid market penetration (1984-2008), MarkeTrak VIII, Kochkin, S. The years 1984 through 1997 were taken from MarkeTrak V.
Figure 3 is a more recent graph showing an upward trend starting in 1997, reversing the declining trend, essentially returning to 1984 penetration levels. The percentages from 1984 through 1997 in Figure 3 were taken from Figure 2. The three later years reflect new data from MarkeTrak Reports since then.
The question to be asked, is what happened between 1997 and 2000 in the U.S. to reverse the declining market penetration, resulting in the mild increase, at least through 2008? The 2008 MarkeTrak VIII survey seems to have been the most detailed, and while the sampled population is the same as in MarkeTrak V, the results represent only those who were aware of, and admit to, their hearing loss (Kochkin, MarkeTrak VIII).
The market penetration increase was estimated to be a combination of more binaural hearing aid sales, fewer in-the-drawer aids, and increases in VA sales and mail order sales. MarkeTrak VI indicated that these additional sales were estimated to account for one-half of the incremental hearing instrument penetration over the last 3 years plotted (2000, 2004, and 2008).
Other hearing aid adoption report percentages spanning a number of years are shown in Figure 4. These represent just a sampling of different estimates reported, and it is certain that even wider ranges can be found in the literature. It seems that the estimated number of persons purchasing hearing aids, as opposed to the number of individuals projected as having hearing loss, provides percentages more characteristic of a shotgun pattern than of the single mark of a rifle.
So, which percentages are correct? For my purpose, the question is irrelevant. To relate this to the intent of my previous post, it makes little difference because none look that good relative to market penetration increase over the years, which was my point.
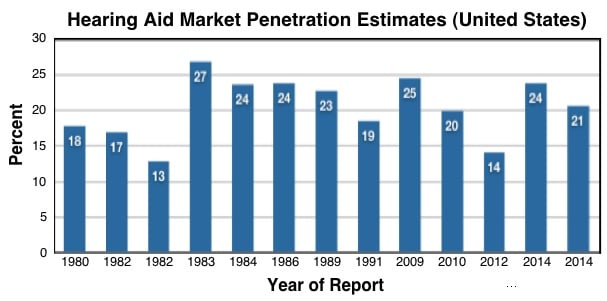
Figure 4. Various estimates of hearing aid market penetration. Following are the references for these percentages, recognizing that few are made using the same measurement criteria.
1980{{5}}[[5]]A survey concerning hearing problems and hearing aids in the United States, 1980, Conducted for the Hearing Industries Association by The Gallup Omnibus, a service of The Gallup Organization, Inc.[[5]], 1982{{6}}[[6]]Mahon, William J. Hearing Aid Industry Report and Statistical Summary, Hearing Aid Journal, 1982, November, 7-16[[6]], 1982{{7}}[[7]]NCHS – National Center for Health Statistics, Riew, P.W., Hearing Ability of Persons by Sociodemographic and Health Characteristics: United States. Vital and Health Statistics. 1982 Series 10, No. 140. DHHS Pub. No. (PHS)82-1568. Public Health Service, Washington, US Government Printing Office[[7]], 1983{{8}}[[8]]Hearing Industries Association, Market development committee survey of the hearing impaired population, 1983[[8]], 1984{{9}}[[9]]Kochkin, S. The VA and direct mail sales spark growth in hearing aid market, 2001, The Hearing Review, December 2001, Los Angeles, CA[[9]], 1986{{10}}[[10]] HIA 1986 HIA marketing survey estimate. Karl Strom, Editor, Hearing Review, March, 1994, Page 7[[10]], 1989 (MarkeTrak VIII), 1991{{11}}[[11]]National Center for Health Statistics (NCHS) 1991, The Hearing Review, March 1995, p. 12[[11]], 2009 (MarkeTrak VIII), 2010 (Amlani), 2012{{12}}[[12]]Chien, W., and Lin, F.R. Prevalence of hearing aid use among older adults in the United States, Arch. Intern. Med. 2012 February 13; 172(3): 292-293[[12]], 2014{{13}}[[13]]Jacobsen, N., and Nielsen, S. Trends and directions in the hearing healthcare market, 2014. William Demant Holding[[13]], 2014{{14}}[[14]]Bisgaard, N. Current approaches to hearing health care delivery, International perspective, EHIMA (GN ReSound AS), 13 January 2013[[14]].
Why Do These Discrepancies Occur?
Market penetration estimates are based generally on: population statistics, hearing aid sales (considering both monaural and binaural wearers), replacement rates, degree of hearing loss, and population sampled. The issue becomes even more confounded when the groups sampled are limited, the degree of hearing loss sampled is not consistent, recognition and acceptance of a hearing loss is considered, etc.
A very basic but important question is, how is the population of hearing impaired defined? Is it based on an estimated percentage of the entire U.S. population, does it exclude certain categories (over 70 years of age, or only those over 50 years of age), does it count households only, does it include individuals who are institutionalized, etc.?
And worse, what constitutes a hearing loss? Who is to say the threshold level should be 16 dB or 25 dB, or for that matter, what does the actual hearing threshold level have to do with any of this, especially when it is not possible to specifically identify what normal hearing is? As Kochkin reminded readers in MarkeTrak VIII, “What remains unanswered is how many people have a practical hearing loss that interferes with their ability to function optimally in a hearing society, making them candidates for treatment.” Or, does it become a problem worthy of consideration when it becomes clinically significant (World Health Organization), a nebulous definition according to many.
Which, if any of these, are the correct approaches? Who knows? How one defines hearing loss affects market penetration percentages substantially. It certainly is possible to report percentages of hearing aid use at 50% or higher or perhaps even below 10%, depending on how one chooses to identify the market sampled. Contributing to this confusion is that many current estimate suggestions are based on census data of individuals 18 years of age and over, not on the overall population (Bisgaard, 2013). If hearing aid sales occur primarily to the elderly, who tend to have more severe hearing losses, and sampled thusly, the market penetration will naturally be high. The issue becomes confounded when younger individuals, and those having marginal hearing loss are included.
Could the projected reversal in use shown in MarkeTrak VIII be accounted for by the fact that the US population growth is resulting primarily due to the aging of America (baby boomers substantial growth), and this is the group most likely to accept hearing aids? If this is true, then what is happening with those who have not reached senior status? MarkeTrak VIII attempted to look at many of these factors.
Making these kinds of determinations is not the intent of this post, nor of the past post. The primary purpose here is to show that estimates vary as to the projected use of hearing aids, recognizing that different methods and population descriptions have, and will continue, to be used. It also shows that it is difficult to assess how many individuals currently wear hearing aids.
Hearing Loss and Health Aging
In January 2014, an IOM-NRC Workshop was held in Washington, DC to determine the impact of hearing loss on healthy aging in older adults. Two of the presentations commented on the market penetration of hearing aids; one was by Frank Lin, M.D., and the other by Nikolai Bisgaard, both of which are referenced in this post. The Workshop was rather extensive, offering much valuable information aside from that regarding market penetration. For this reason, links are provided so that readers can access the contents.
The IOM Workshop Report is available at: https://www.iom.edu/Reports/2014/Hearing-Loss-and-Healthy-Aging.aspx, and at: https://www.iom.edu/Activities/PublicHealth/HearingLossAging/2014-JAN-13.aspx.
Additional information, including the video presentations related to hearing aid market penetration are available for Bisgaard at: https://www.iom.edu/Activities/PublicHealth/HearingLossAging/2014-JAN-13/Day 1/Session III/14-Bisgaard-Video.aspx, and for Lin at: https://www.iom.edu/Activities/PublicHealth/HearingLossAging/2014-JAN-13/Day 1/Welcome and Opening Remarks/2-Opening-Remarks-Video.aspx.
Addendum on Hearing Aid Market Penetration
However, because hearing aid marketing is being discussed, it is interesting to take the topic a bit further. For example, how does the percentage of hearing aid use compare among selected countries? Figure 5 addresses that question.
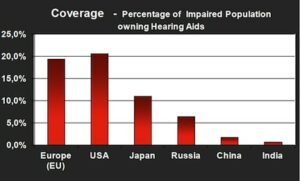
Figure 5. Comparisons of hearing aid penetration throughout the world (Bisgaard, 2013).

Figure 6. Hearing care, in general, comes with higher standards of living (Bisgaard, 2013).
Additionally, is hearing aid market penetration rate in a country related to per capita income? Figure 5 shows a positive correlation between the two (Bisgaard, 2013).
Summary:
So, what is the true market penetration? It depends on what you want to show. My intent in last week’s post was to show that market penetration seems not to have advanced significantly in past years. Nothing in this post’s additional market penetration data challenges that point. Perhaps next week we can get back to focusing on the more important issue of looking forward, rather than backward, to issues that may drive market penetration upward. But, don’t expect to read about failed approaches utilized in the past. New thinking is required.