

Are you willing to bet that many audiologists focus on selling as many high-cost premium hearing aids as possible in order to make a living? Ethics aside, it sounds logical that you’ll make more money if you sell more expensive stuff, whether it’s diamonds or hearing aids. Maybe so for top-quality gemstones, but don’t take the bet for hearing aids. Aggregate data for the last decade tells a different story (click on the link for supporting figures for the following items):
- We don’t sell many premium aids — less than 30% of the market in any given year.
- Sales in the industry are trending down the “value chain,” not up.
- Wholesale Cost rises faster for premium instruments than the market as a whole.
- Retail Price of premium products has remained relatively flat ($10/year) compared to increasing Price in the industry as a whole ($45/year).
- Nominal dollar “markup” is rising for instruments as a whole (Figure 1: $122/year) but falling for the subset of premium products (Figure 2: -$44/year). Changes were most apparent for 2013.
A Second Bet
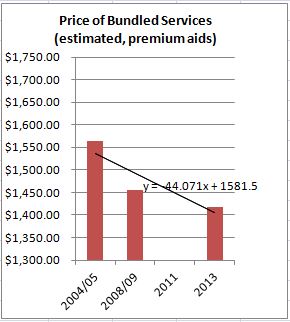
Figure 2. Average estimated “markup” over hearing aid invoice cost for premium technology instruments.
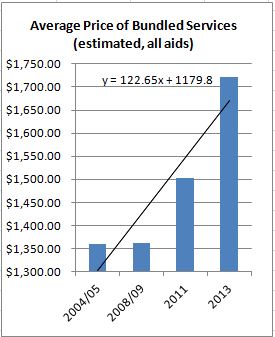
Figure 1. Average estimated “markup” over hearing aid invoice cost for hearing aids in general (all types).
If the same set of services (consult, order, fit, follow-up) is required regardless of technology, at a cost to the practice of $1400-1700 per instrument, then “many” Audiologists{{1}}[[1]]”Many” may not be most but it does sound close to “median” or “mean,” especially when making a statement about Audiologists in general.[[1]]realize no additional financial benefit when they sell more costly hearing aids.
From Figures 1 and 2, it appears at least some Audiologists lose financial ground by promoting premium instruments to patients. That may not be good for patients. But it is consistent with anecdotal reports of value chain downtrending while overall Price is rising a bit each year. Therein lie the grounds for an opposing bet:
Who wants to bet that Audiologists are focusing on selling lower level technologies to make a living?
Wow, really? One hopes that Audiologists are recommending the best technology for an individual patient’s needs and budget constraints. We have the instruments to do that, the skills to figure it out, and the ethical practice standards to guide us.
But Figs 1 and 2 tell us that Audiologists in general are likely to derive lower margins on higher cost goods because of the narrowing wholesale-to-retail gap in premium pricing. The economic argument says go for the margins, of course. The ethics say tailor to the individual patient. Houston, we may have a problem.
If Figs 1 and 2 are even slightly valid, you may be willing to bet that technology is sacrificed for margin under the same retail Price. It sounds like an ethical issue. It also sounds like an excellent argument for unbundling Price to increase transparency to consumers by explaining (and covering) practice costs of service delivery. To the extent that Audiologist do that,their ethics and economics fall into lockstep.
Is This the Way it is in Real Audiology Life?
Three representative practices
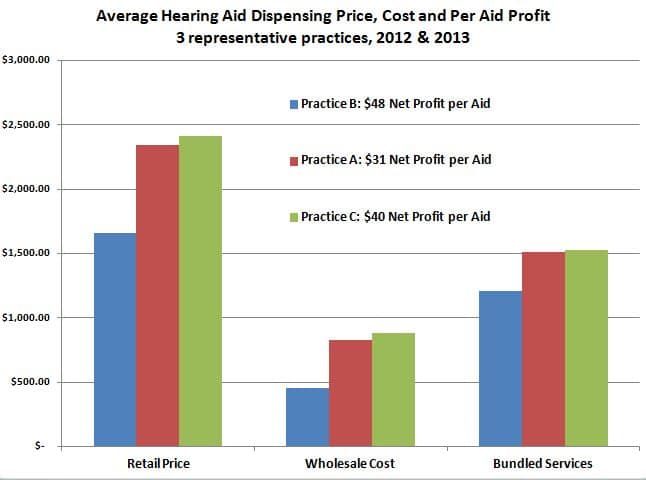
The caveat last week was that averaged, cross-sectional data may not accurately reflect individual Audiologists’ purchasing and selling habits. Although individual practice data are a less powerful form of evidence than statistically-treatable distributions{{2}}[[2]]The survey data are not randomly sampled, but if they’re big enough they’ll almost certainly begin to approximate normal distributions.[[2]], they can serve as a rough crosscheck and partial validation of assumptions underlying the two opposing bets. Perhaps Audiologists fall somewhere in the middle between the two betting extremes? Today’s post looks at three “representative” practices (Fig 1) which have been described and used before in the Pricing series. Click the link to read more about them and why they were selected. Figure 1 makes these points:
- Practice B (blue) has the highest net profit per aid ($48/aid) of the three practices.
- Practice B pays roughly 1/2 as much for its instruments as Practice A (54%) or Practice C (51%).
- Average COGs{{3}}[[3]]Cost of Goods.[[3]] are consistent with a practice (B) that predominantly fits basic technology instruments and two practices (A and C) that fit mid to premium instruments.
- Practice B’s average retail Price is 69%-71% of the other two practices, about 30% lower.
- Retail Prices are consistent with one practice that prices below the industry average (B) and two practices that follow the norm for fitting low, mid and premium products. (A and C).
- Markup for services is about $1200 for Practice B and $1500 for the other two.
Markup is less for Practice B, but COG and other practice costs are lower as well, yielding a higher margin and highest Quantity Sold of the three practices. The bottom line is that Practice B fits lowest technology, fits most aids, generates most revenue, and makes highest marginal profit. Now, if only we had outcomes data to match up with the three practices, we might have a feel for that elusive “value practice model” we’ve been hearing about recently.
So, Who Wins?
Back to the bets. Even with sketchy data, anybody that took Bet 1 lost out. Focusing on premium product upselling is not a strategy for Audiologists who want to “make a living.” Or at least a big living. Bet 2 paid off for Practice B — focusing on low-end technology and good margins pays off in revenue and quantity. No word on quality and user satisfaction.
But there’s a silver lining here. The other two “representative” practices are not leaning toward either bet. They’re right in the middle of the average data, fitting a reasonable number of hearing aids of better-than-average technology at prices that include an average markup to cover services.
Two out of three isn’t bad. Guess you can always bet on the averages and break even.
Editor’s Note: all data sources found here and in Hearing Review 2013 Hearing Aid Dispenser Survey.
(Editor’s note: This is Part 21 in the multi-year Hearing Aid Pricing series. Click here for Part 20).