By David H. Kirkwood
 WASHINGTON, DC–
The portion of Americans with self-reported hearing difficulty who own hearing aids has increased to 30.2% (from 24.8% in 2008), and the satisfaction rate with hearing aids has grown to 81% from 74%, according to the MarkeTrak 9 survey conducted last fall by Az Marketing Research with Online Survey Solution for the Better Hearing Institute (BHI), part of the Hearing Industries Association (HIA).
The findings reported in this post are from MarkeTrak 9: A New Baseline, a confidential 183-page report given exclusively to HIA members in early April, but obtained this week by the blog Hearing Health & Technology Matters (HHTM).
NOT JUST ANOTHER MARKETRAK
MarkeTrak 9 (MT9) is the latest in a series of surveys conducted for BHI since 1989, and the first since MarkeTrak 8 in 2008. Its objectives are similar to, though broader than the previous surveys. These objectives include:
- To estimate rates of hearing difficulty and hearing aid use in the U.S., and to track them over time and compare them with rates in other countries.
- To gain “market insight” from people with hearing difficulty to understand more about the impact of hearing difficulties on them and about their experiences with hearing professionals and devices on the “patient journey.”
However, MT9 is very different from the previous surveys for several reasons. For one thing, participants, designed to be representative of the entire U.S. population, were surveyed online, rather than by written surveys of the National Family Opinion (NFO) mail panel, as in the past.
Also, MT9 used a “masked objective” technique, in which the study was introduced as being about “health” rather than hearing loss or hearing aids. This technique, the report explains, is intended to “generate more honest estimates of conditions/perceptions because respondents cannot immediately guess what it takes to ‘qualify’ to participate, as some are motivated to do.”
Moreover, unlike the eight previous MarkeTrak surveys, which were directed by Sergei Kochkin, PhD, the former executive director of BHI, MT9 had a new team in charge: Carole Rogin, president of HIA; principal researchers Jan Kihm of Az Marketing Research and John Graham of Online Survey Solutions; and contributing researchers Debbie Wachtel of Beltone and Mary Hennessey of Starkey Hearing Technologies.
For these reasons, among others, comparisons between this survey’s findings and those from past surveys are of doubtful validity. For example, the report notes that part of the apparent 5.4% increase in the percentage of hearing aid users between 2008 and 2014 “is likely due to the change in method, including the incorporation of the masked objective.”
So, rather than being seen as the latest in a continuing series of MarkeTrak surveys, the report states, “In many ways, MT9 is a new baseline,” which “will provide a solid backdrop on the market” and “be a reference and starting point for future analyses and publications, as well as follow-up research.”
A TWO-PART SURVEY
Conducted last fall, MT9 was divided into two parts. First, it surveyed 17,038 heads of households for the purposes of estimating rates of hearing difficulty, hearing aid ownership, and hearing aid adoption. In this part of the survey, MT9 identified 3079 individuals with hearing difficulty, of whom 980 owned hearing aids and 2099 did not.
Part 2 collected detailed information from those individuals about “key aspects of the patient journey,” including their experience with hearing difficulty, with healthcare professionals, and with hearing aids and other solutions.
HIGHLIGHTS
The lengthy survey produced an enormous quantity of data, only a small fraction of which will be reported here. In this, the first publication on MarkeTrak 9, we will share with a larger audience some of the highlights from the unpublished report for HIA members.
Of those surveyed, 10.6% (3079) reported having hearing difficulty, an incidence that, if typical, indicates that there a little more than 33 million Americans with the problem. In the total survey sample, 3.2% said they owned hearing aids. Of those with hearing loss, 30.2% reported having hearing aids.
Several of the report’s findings augur well for the hearing aid market. The average age of hearing aid owners was younger than in the 2008 survey, and more of those surveyed were wearing their first hearing aid.
Also, the percentage of survey respondents who said they were given a hearing screening as part of a physical exam was 23%, up from 15% in 2008. For decades, HIA has tried to persuade primary-care physicians to routinely test patients for hearing loss since that is often the first step toward the purchase of hearing aids.
Satisfaction rates high and rising
On a scale from 1 to 7 where 7 was very satisfied and 1 was very dissatisfied, 81% of the hearing aid wearers surveyed gave their current instruments a score of 5, 6, or 7. Satisfaction was even higher among the 340 respondents with new hearing aids (up to 1 year). Of these, 91% gave them a 5, 6, or 7, and 43% picked 7, very satisfied; just 1% said they were very dissatisfied. All these satisfaction scores are higher than those found in previous MarkeTrak surveys.

MT9 found that the great majority of hearing aid wearers found that the devices improved their quality of life at least some of the time. Figure from the Final Report of MarkeTrak 9.
Satisfaction rates varied by model of hearing aids. Ninety-eight percent of people with CIC (completely-in-the-canal) said they were satisfied, while in-the-ear devices satisfied 78%.
Asked which on a list of attributes had the greatest impact on their overall satisfaction with their hearing aids, respondents selected Value and Sound Quality at the top, closely followed by Enhanced Features, while Appearance was ranked at the bottom.
According to the report, in the Enhanced Features category, “The factor that seems to be affecting hearing aid satisfaction most is wireless technology.”
The survey also asked owners how their hearing aids compared with their expectations. Those with instruments purchased more than a year ago were most likely to say they were about what they expected. However, 53% of owners of hearing aids bought in the past year said they were better than expected and just 5% felt they were worse than expected.
Hearing care professionals score even higher
As was consistently found in past MarkeTrak studies, consumers give their hearing care professionals substantially higher ratings than the devices they dispense. In MT9, a remarkable 95% of hearing aid owners and 87% of non-owners said they were satisfied with the professionals they had seen in the past 5 years.
Why most still go without
Despite the high satisfaction rates with hearing aids and the apparent increase in hearing aid use, more than two out of three Americans with self-reported hearing difficulty do not wear hearing aids. MT9 looked at reasons why not.
The most common reasons for not buying hearing aids, the report states, are “financial constraints and lack of a perceived need.” Among non-owners who have not visited a professional, 51% gave Can Hear Well Enough as their reason for not getting hearing aids, while 39% said they were Too Expensive and 31% said they Cannot Afford.
Among non-owners who have been advised by a professional to get hearing aids, Too Expensive (55%), Cannot Afford (40%), and No Coverage (32%) were by far the most frequently cited reasons for not taking action.
As for what might inspire action, MT9 asked non-owners to select from a list of factors the ones they felt would motivate them to get hearing aids (sooner). The top two choices, by far, were “Having insurance that will cover some/more of the cost” (51%) and “A hearing test that makes it clear to me that I need one” (36%).
Interestingly, MT9 found that half of those who owned hearing aids got some third-party help, and the percentage rose to 55% for purchases in the past year. Insurance (35%) and the VA (27%) were the third-party payers cited most often.
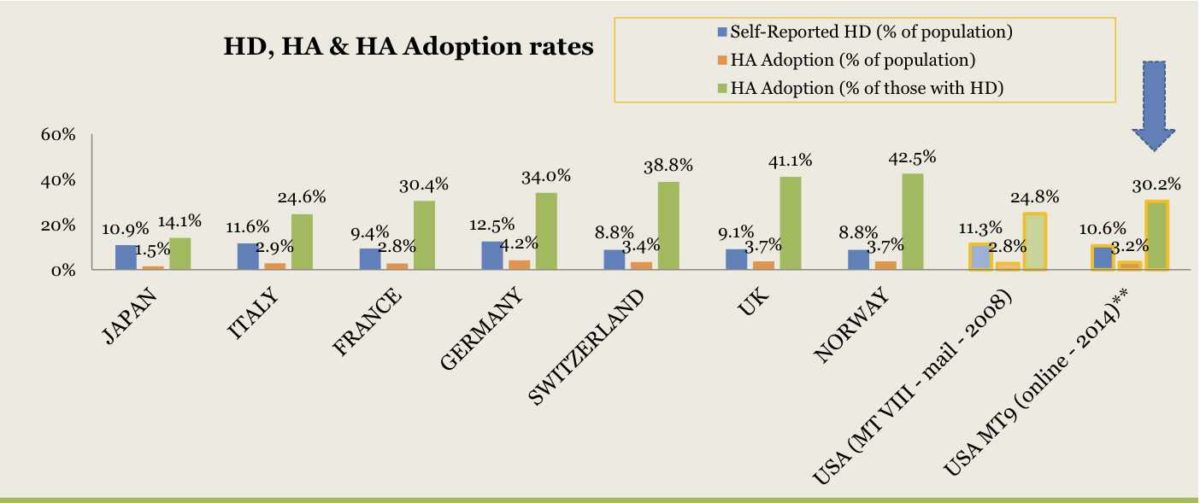
Results of MarkeTrak, EuroTrak, and JapanTrak surveys reveal wide differences among countries in the incidence of hearing difficulty and hearing aid adoption. Figure from Final Report of MarkeTrak 9.
HOW THE U.S. COMPARES
A new part of MT9 compares its findings with those from EuroTrak and JapanTrak surveys that used the same methodology, and were reported on by Hearing Review in 2013.
The 30.2% hearing aid adoption rate for Americans with hearing difficulty placed the U.S. somewhere in the middle of the pack. On the low end, the rate in Japan was 14.1% and Italy 24.6, while Norway (42.5%), the United Kingdom (41.1%), and Switzerland (38.8%) had the highest rates. France (30.4%) and Germany (34.0%) were not far from the U.S.
America’s hearing aid satisfaction rate of 81% was higher than any other country except Switzerland’s (84%), but the other Western European countries surveyed were all in the range of 70%-80%. Japan was the laggard; there only 36% said they were satisfied.
MORE TO COME
MT9 has generated a treasure trove of information about the incidence of hearing difficulty, its effects on those who experience it, and the “patient journey” that, we all hope, will conclude with addressing hearing difficulty successfully. This study is certain to be the subject of a great many publications after this one.