

The Audiology Labor Force series showed a stationary, or possibly decreasing, audiology workforce from 2000-2015, despite a median nominal wage increase of $2100/year over the same period (see feature image). Does this mean that our profession lacks career appeal?
Probably not, considering audiology’s consistently high ranking in “best jobs” lists compiled by US News and World Reports and Time Magazine in recent years.
Preferred, but Not Attained
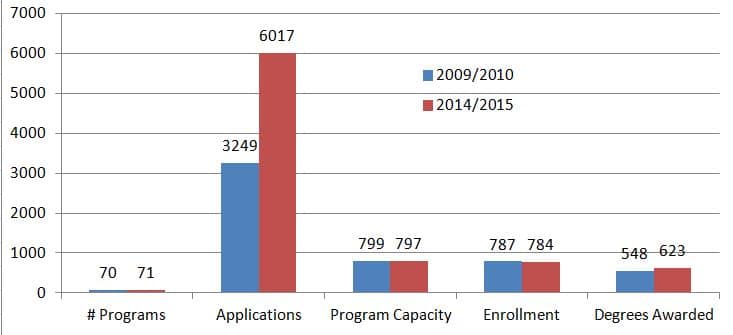
Figure 1. Comparison of audiology graduate program statistics for two time periods (adapted from Windmill & Freeman, 2017)
College graduates read those “best jobs” reports. Almost twice as many graduates applied to audiology doctoral programs in 2014 as in 2009 (Figure 1). Unfortunately, many didn’t get in and presumably chose an alternative career.
Windmill and Freeman’s post found that despite the doubling of the applicant pool, there was little or no growth in US doctoral programs, program capacity, enrollments, or graduates since 2009 (Figure 1).
Econ 202: Supply Thoughts, Given Increases in Demand
Audiologist Supply could be “inelastic” in economic terms, meaning the percentage change in audiologists is small or none with changes in wage. Supply becomes more inelastic in our situation due to factors such as capacity (e.g., operating at full), labor constraints (e.g., student applicants don’t meet minimum standards; not enough externship opportunities), and short term effects (e.g., capital investment, faculty slots). Assessing those factors and calculating or deriving elasticity requires economic analyses which are left for a later post.
For today, the economic argument is based on face validity, using Figures 2a and b as examples to illustrate scenarios. In the charts, Q refers to quantity of Audiologists employed at Equilibrim, P refers to employment wage at Equilibrium.
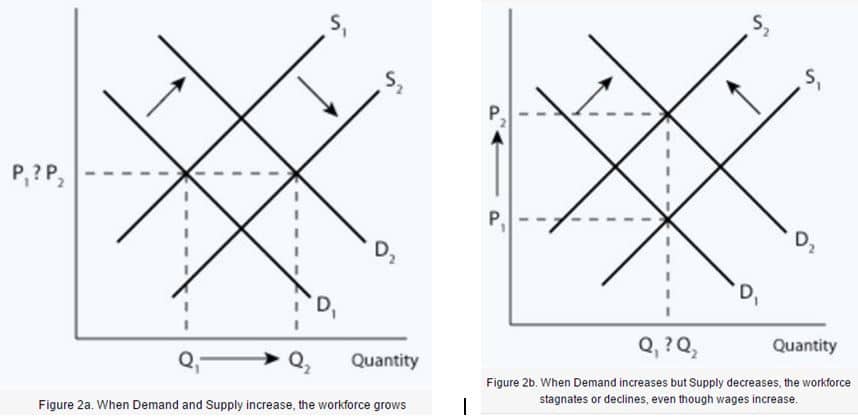
On the face of it, increasing consumer demand for hearing services and the rising equilibrium wage support the notion that there is increasing Demand for our profession. In the charts this is manifest by a rightward (upward) shift of D1 to D2 in both figures, yielding expected change in Quantity of audiologists from Q1 to Q2,.
Likewise, “best jobs” and increased demand to enter the field (doubling of graduate school applications) support the notion of increasing Supply of audiologists. In the charts, this is manifest only in Figure 2a, with a rightward (upward) shift of S1 to S2. The result is a change in Equilibrium, from (P, Q1) to (P, Q2), shown by the horizontal axis arrow. Whether or not wage moves depends on the influence of more available labor in the market, but the point is that the workforce grows at Equilibrium.
Figure 2b differs, in that Demand is growing but Supply of audiologists is decreasing (S1 to S2 shifts leftward). As described by Freeman and Windmill, this could happen due to fewer graduates entering the field; higher attrition rate through retirement and other factors; and increases in worker productivity resulting from technological innovation. Whatever the reason, the result is a change in Equilibrium, from (P1, Q) to (P2, Q), shown by the vertical axis arrow. Wage increases because labor becomes scarce, but the point is that the workforce does not grow at Equilibrium and a shortage results.
In Our Little World
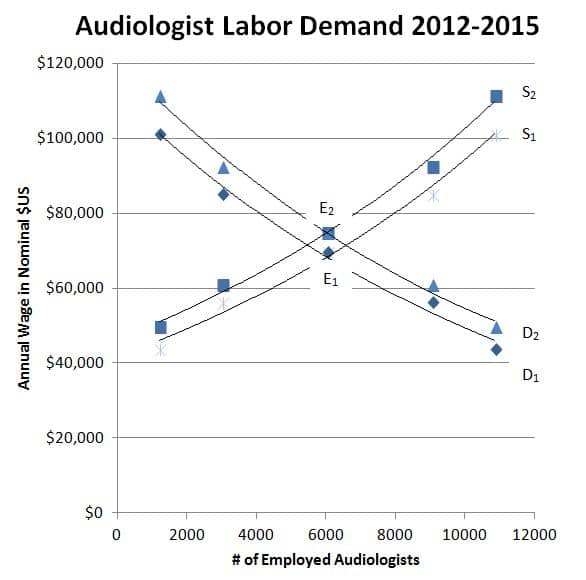
Figure 3. Audiologists’ Willingness to Work in 2012 (S1) and 2015 (S2); Employers’ Willingness to Pay in 2012 (D1) and 2015 D2); Market clearing Equilibrium point in 2012 (E) and 2015 (E ). Data from US Bureau of Labor Statistics.
Skipping theory and checking out actual data, Figure 3 shows putative Supply (Willing to Work, WtW) and Demand (Willing to Pay, WtP) for the audiology workforce in two different years. No big surprise that our real world looks a lot like the theoretical world of Figure 2b.
The only points of importance in Fig 3 are the two Equilibria (E1 and E2) where Demand and Supply intersect for 2012 and 2015 data, respectively. E1 and E2 sits directly atop each other, meaning that median wage increased but the number of those Willing to Work did not budge. In other words, Demand for labor grew, shifting from D1 to D2 as employers’ WtP increased. But the number of workers did not keep up. Instead, Supply shifted downward from S1 to S2 as the same number of workers stayed in the workforce, just working for a higher wage in 2015.
He Who Pays the Piper Calls the Tune
This is a short term situation because those “equilibria” in Figure 3 are for the audiology workforce, not the entire hearing healthcare workforce. If there’s a Demand, Supply will get there eventually. If short term effects and capacity constraints limit Supply of audiologists, others will be hired (and trained) to substitute and meet Demand.
This discussion of the audiology labor market has not taken substitutes into account. There are already too many graphs in this post but we’ll finish with one more and take up discussion of it in a future post.
For those who have read this post with some attention– and who are mindful of the current national social policy discussions on hearing devices and healthcare in general –there’s no need to go through the painful exercise of working through Figure 4 to arrive at the obvious conclusions.
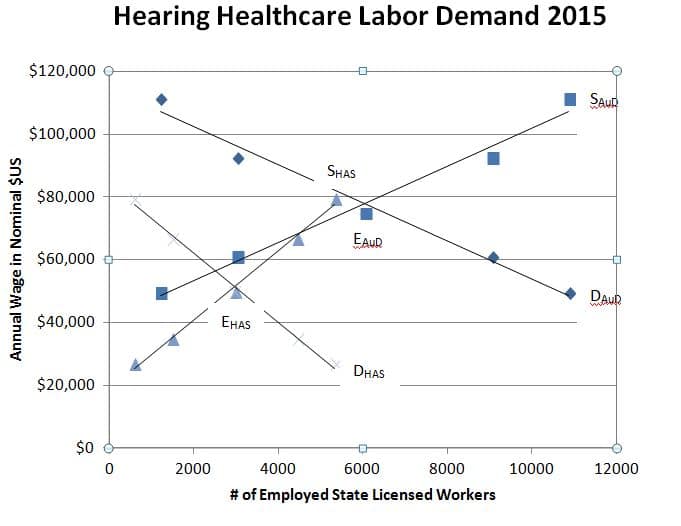
Figure 4. Willingness to Work (Supply) of Audiologists (SAuD) and Hearing aid Specialists (SHAS) in 2015; Willingness to Pay (Demand) for Audiologists (DAuD) and Hearing Aid Specialists (DHAS) in 2015. Market clearing Equilibria are E(AuD) for audiologists and EHAS) for Hearing Aid Specialists, showing that the latter are a substitute good in this market..
The short term will not prevail in an open market. In our market, there are substitutes for audiologists, ready and Willing to Work. There are employers ready and Willing to Pay, and probably willing to step in and train if that’s what it takes to eliminate the shortage in the long run.
Figures 2a&b adapted from econport