by Amyn M Amlani, PhD
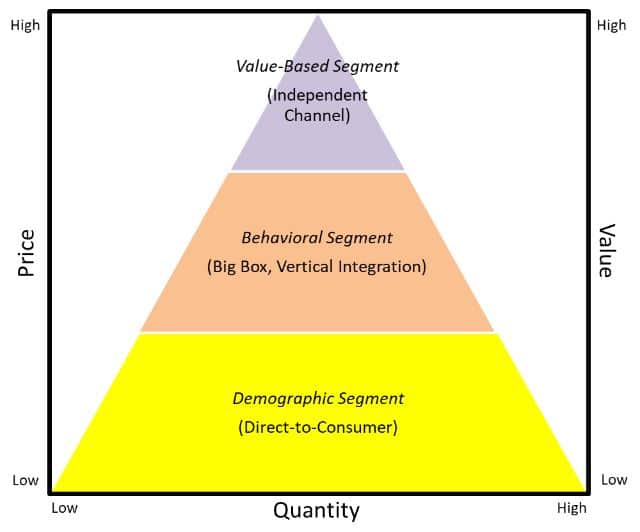
In Part 1 of the series on “Pricing in Hearing Healthcare: Which Race are You Running?,” the reader was provided with an overview of the supply-side’s strategy to reduce retail prices to encourage product uptake/adoption. Such a strategy, it was contended, supported the transition of hearing healthcare from a predominately provider-based market segment to a multi-segmented retail model, shown in Figure 1.

Figure 1. Market Segmentation Occurring in Hearing Healthcare
In Part 2 of this series, we highlight how practices that participate in reducing retail pricing run the risk of decreased profit opportunities by means of market and brand cannibalization.
What is Market Cannibalization?
Market cannibalization is the reduction in sales volume, sales revenue, or market share caused primarily by:
- the introduction of a new product by the same producer;
- lowering/discounting prices of a product; and
- a saturation of the same retail companies in close proximity.
Examples of (1) and (3) above, respectively, include Apple’s introduction of the iPad and its negative affect on the sales of the MacBook and Walmart’s decision to close profitable stores due to direct competition with its own stores.
Economics of Lowering/Discounting Price
In hearing healthcare, there is a notion that reducing retail price of a product manifests in an uptake in adoption that yields to an increase in gross revenue. To quantify the effect of reducing retail price, we utilize the economic principle of law of demand.
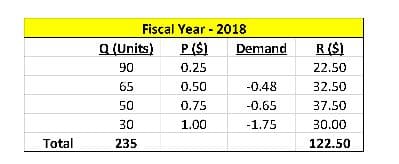
Below is an example of a retail outlet that sells pencils. Table 1 displays that this outlet sold four different levels of pencils at varying prices (i.e., P), totaling 235 units (i.e., Q) for fiscal year 2018, yielding a gross revenue (i.e., R) of $122.50. This demand function is graphed in Figure 2.

Table 1. Retail outlet data for fiscal year 2018. Key: Q = quantity sold; P = price, and R = gross revenue (i.e., Q x P).

Figure 2. Demand function for data shown in Table 1.
Prior to fiscal year 2019, the owner of retail outlet elected to reduce prices by $0.05 for all four pencil levels. The owner’s notion was that reducing prices would yield an increase in units sold and, in the end, an increase in gross revenue.
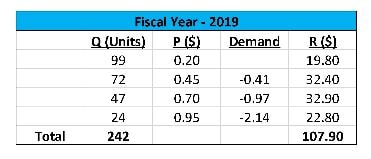
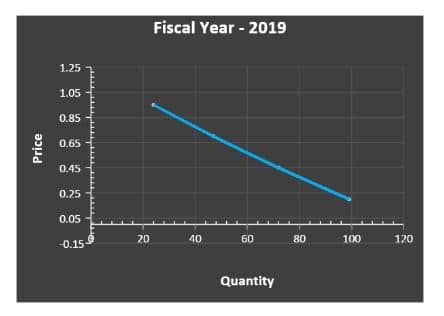
At a minimum, the owner hypothesized that the market would increase organically by 3%, or 7 additional units (i.e., 235 x 3%), to 242 units. What the owner had failed to realize was that the market yielded an inelastic demand. Results for fiscal year 2019 are shown in Table 2 and Figure 3.
Note: The hearing aid industry has an inelastic demand. To that end, an inelastic demand indicates that lowering price will not result in an appreciable increase in the number of units sold and increasing prices will not result in a marked decrease in the number of units sold. In addition, increasing total revenue in an elastic market requires reducing price and increasing total revenue in an inelastic market dictates increasing price.

Table 2. Retail outlet data for fiscal year 2019. Key: Q = quantity sold; P = price, and R = gross revenue (i.e., Q x P).

Figure 3. Demand function for data shown in Table 2.
When comparing the data between fiscal years 2018 and 2019, note that the total number of units increased from 235 to 242. The data further suggest that in fiscal year 2019, 16 more units (i.e., 171 units compared to 155 units) were sold than in fiscal year 2018 for the two lowest price points. For the two highest price points, a decrease of 9 units (i.e., 71 units compared to 80 units) was seen between fiscal years 2019 and 2018.
Despite the increase in units sold for fiscal year 2019, total gross revenue yielded $14.60 less than the total gross revenue in fiscal year 2018. Stated differently, this retail outlet yielded an average transaction of $0.52 per unit sold (i.e., $122.50/235 units) in fiscal year 2018 compared to an average transaction of $0.45 per unit sold (i.e., $107.90/242 units) in fiscal year 2019.
In this example, the practice cannibalized its own gross revenue by reducing prices. A similar effect on total gross revenue is often seen in hearing healthcare when practices attempt to provide the market with reduced hearing aid prices.
***Note: The reader should note that the commentary in this blog is not directed at practices that negotiate lower COGs and offer products and services at non-reduced retail prices. This strategy will be broached in a future blog.
Effect of Reduced Retail Pricing on Purchase Intent
Price-quality inference theory1,2 predicts that consumers often perceive prices as an indicator of quality. That is, consumers use price as a perceptual compass of quality. When a retail outlet lowers its price, the consumer perceives that the product or service being purchased has a diminished quality. Simply stated, quality perceptions influence purchasing intent more so than price.3,4
At the same time, higher quality also means that consumer demands an exceptional experience during the purchase process.
Effect of Reduced Retail Pricing on the Multi-Segmented Market in Hearing Healthcare
Part 1 of this series revealed that the market was transitioning from a provider-based market segment to a multi-segmented retail model, the latter of which is shown in Figure 1. Independent practices in the value-based segment who elect to compete on reduced retail price not only diminish their brand, but often transition from the top of the pyramid to the middle and bottom where they are electing to compete with retailers in the Big Box and vertical integration channels, as well as with the direct-to-consumer retailers, respectively.
For those independent practices who participate in the reducing pricing game, their downward transition—or race to the bottom—creates self-induced competition against corporations with greater brand awareness, and perceptually unlimited resources and marketing budgets.
Summary
In Part 2 of this series, the reader was made aware of the impact of reducing price on (1) total revenue, (2) consumer purchase intent, and (3) the downward transition within the segmented market pyramid. For practices to sustain their place in the market—given the predicted compression of traditional devices as the direct-to-consumer market evolves—it would be wise to stay in their lane (i.e., operate in the value-based segment) instead of playing “chicken” with retailers in the behavioral and demographic segments.
Next month, in Part 3 of this series, we will evaluate the impact of third-party reimbursement on this market pyramid and its effect on the race to the bottom.
References
- Olson JC. (1977). Price as an informational cue: Effects on product evaluation. In AG Woodside, JN Sheth, PD Bennett (eds), Consumer and industrial buying behavior (pp. 267-286). New York: North Holland.
- Monroe KB, Dobbs WB. (1988). A research program for establishing the validity of the price-quality relationship. Academy of Marketing Science, 16(1): 151-168.
- Tellis G, Gaeth GJ (1990). Best value, price-seeking, and price aversion: The impact of information and learning on consumer choices. Journal of Marketing, 54(April): 34-45.
- Shirai M. (2015). Impact of “high quality, low price” appeal on consumer evaluations. Journal of Promotion Management, 21(6): 776-797.


