Centering Surprises in Asymmetrical Listeners
H. Christopher Schweitzer and Don Kim
One of the first activities in audiological assessment is that we argue with Nature. We test one ear isolated from the other.
Dr. Schweitzer is Director of HEAR 4-U International; Chief of Auditory Sciences at Able Planet, Inc.; and Senior Audiologist, Family Hearing Centers in Colorado. Dr. Kim is Senior Clinical Audiologist, Able Planet, Inc. and Audiology Manager for Neosound, LLC, both in Colorado.
One of the first activities in audiological assessment is to argue with Nature. For example, the hearing measurement setup acoustically isolates the right ear from the left. The test then proceeds, and individual ear results are recorded. Quite possibly, even the best clinician gives little thought to the underlying surprises that may lurk below the threshold pattern of the then dissected hearing system. In asymmetrical cochlear pathology, the surprises may be especially noteworthy. For such clients, with thresholds of one ear significantly worse (40 dB or more) than the other, it may not occur to many audiologists to examine the inter-ear differences at common listening levels. Given that most listening experiences are organized around “comfortable” listening levels for broadband signals (rather than pure tones at threshold levels), it seemed appropriate to investigate.
Simple lateralization tasks were conducted for 29 asymmetrical hearing loss subjects using one of two standard clinical audiometers (Grayson Stadler GSI-16 and Fonix FA-10) calibrated with TDH 39P headphones. The subjects were asked to verbally assist adjusting the relative presentation in 5-dB and 2.5-dB steps. The characteristic finding is represented by two cases that are shown in this two-part series.
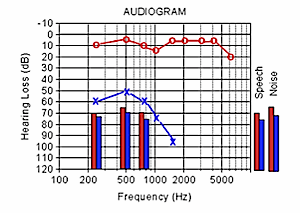
Figure 1 shows the results for a 49-year-old female with a congenital, severe sensorineural impairment of the left ear with audiometric thresholds plotted on a logarithmic frequency scale (slightly unconventional to standard audiograms), but all values are in dB HTL. No masked thresholds were detected at 2 kHz and above. The right ear is essentially normal. The masked air-conduction thresholds (X’s) for the Left are obviously severe with No Responses at 2 kHz and above. She has average L/R threshold differences for frequencies 250, 500, 750, 1k, and 1.5 kHz of about 60 dB. She has worn a hearing aid in the bad ear for over 20 years. Hence, it can be assumed that the impaired side was accustomed to sensory stimulation, a point of some relevance. History, reflex testing, and other differential diagnostic findings strongly support a cochlear site of lesion, of undetermined congenital cause.

Figure 1. Threshold and plotted examples of levels to achieve balances for selected signals for an asymmetrical listener.
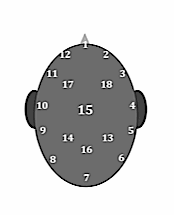
A unique element of this audiogram is a portrayal (vertical bars) of the measured inter-ear levels required to achieve a “center of the head” perceptual experience at comfortably loud sensation levels. To obtain these measures a relatively simple protocol {{1}}[[1]] Schweitzer, C. & Smith, D. (2010). Meeting in the Middle with Unequal Ears. Hearing Review 16(4) 19-26[[1]] was introduced (illustrated next week in Part II of this series) using standard audiometric headphones. Listeners were asked to report the location of the perceived sound using a reference chart shown in Figure 2. Selected signals were manually adjusted to each ear by the examiner until the target (center of head, No. 15) was achieved.

Figure 2. Illustration of the numbering chart used to locate the perceptual experience for the various signals. Listeners directed the investigator to adjust the relative Left-Right levels until the stimulus was perceived in a position as near as possible to number 15.
The selected signals were pulsed pure tones (bars within the audiogram of Figure 1), recorded speech from Cox’s connected discourse, and steady speech noise (bars to the right of the audiogram). The bar colors represent the right (red) and blue (left) ears respectively.
With stimulus presentation levels to the better ear set to a “comfortable” setting, interactive adjustments were made to the poor ear level using a bracketing approach until a center-point position of the pulsed tone signals was reported. Three determinations of the levels with incremental changes as small as 2.5 dB were made for each stimulus to provide confidence in the measured levels at 250, 500 and 750 Hz. It was not difficult for listeners to reach the desired “center of the head” level relatively quickly and without variation on the three repeated determinations for each signal. The recorded tonal measures are shown as red/blue bars for this subject in Figure 1. The differences at the two ears were less than 7.5 dB, in some cases less than 5 dB! In other words, a pattern of “loudness catch-up” was observed through an assumed combination of unmasked cross-over and binaural processing. The pattern is somewhat similar to the steep growth of loudness associated with classic sensorineural hearing loss patterns as compared to normal hearing patterns. Live voice conversational speech was also introduced as indicated in the “speech” bars.
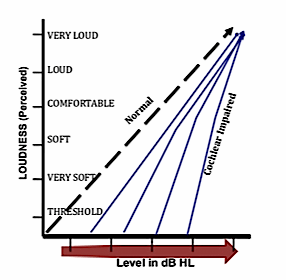
The inter-ear difference convergence at supra-threshold presentation levels brings to mind the familiar loudness growth patterns, the basis for many amplification assumptions, shown as a reminder to the reader in Figure 3{{2}}[[2]]Florentine, M. (2004). Softness imperception: Defining a puzzling problem. Hearing Health 20(1) 31-34[[2]]{{3}}[[3]]Florentine, M. (2003). Page 10: It’s not recruitment – gasp! It’s softness imperception. Hear Jrnl. 56(3)10-15[[3]]{{4}}[[4]]Buus S., Müsch H., & Florentine M: On loudness at threshold. J Acoust Soc Am 1998;104:399-410[[4]].

Figure 3. Generalized representation of classical “Growth of Loudness” patterns indicating steeper than normal function for sensorineural hearing impairment. 2, 3, 4, 5, and 6 have suggested a ‘softness imperception’ aspect of the abnormality, rather than loudness ‘recruitment’.
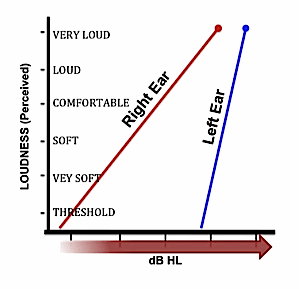
It is well established that large individual differences exist in loudness growth patterns among listeners with sensorineural hearing loss {{5}}[[5]] Marozeau, J. & Florentine, M. (2007). Loudness growth in individual listeners with hearing losses: A review. J Acoust Soc Am Express Letters DOI 10.1121, August[[5]]{{6}}[[6]] Buus, S. & Florentine, M. (2001). Growth of loudness in listeners with cochlear hearing losses: Recruitment reconsidered. J Assoc Res Otolaryng. 05, 120-139[[6]]. Likewise, inter-ear differences in asymmetrical hearing sensitivities present numerous additional uncertainties related to balanced auditory perception. As mentioned above, the relation of “cross-over” stimulation could not be separated out in these observations. Since the better ear also received simultaneous stimulation of the same signal, it is difficult to sort the binaural processing aspect. But it seems reasonable to speculate that post-cochlear processes through the brainstem and mid-brain nodal centers may have contributed to the net experience of de-lateralized perception. Conceivably, such pathways may have been the dominant effect, but this clinical research lacks the measurement sensitivity or methodological rigor to inquire deeply into the neurophysiological mechanisms. Whatever the pattern, when studied at several presentation levels, for these listeners generally resembled that characterized by Figure 4.

Figure 4. Behavior pattern for several subjects with unilateral sensor-neural impairment showing a similar nonlinear loudness patterns to those of Figure 3. This figure is illustrative rather than data-based.
Part II, scheduled for next week, will show the results from an additional subject, along with describing the test environment and test procedures.


I’m curious; with this essentially left-corner audiogram for the left ear, what was this clients aided and masked WRS? If there was truly no significant improvement in WRS, would she be a better candidate for CROS techonology?
Answr: I generally have very little confidence/use for isolated single word list tests. As a point of fact that patient Did
have a CROS aid when I first met her. My view is to encourage ‘stimulation’ of the injured side, rather than abandonment whenever possible. That subject routinely has now successfully worn a hearing aid on that injured ear for over 25 years. She happens to be my wife and part of the motivation to conduct these studies.
cs
How is that for a coincidence; my wife of 23 years developed a vestibular schwannoma three years ago. Led to complete removal of the left auditory and vestibular nerve removal. Now deaf in the left ear, she’s wearing a CROS system. Makes a good guinea pig when new stuff comes out. Has worn the Unitron Tandem-16, now wearing Phonak Audeo IX w/CROS. Widex just released a new system and I’m going to have her try it.
It’s bizarre about CROS technology (including BiCROS, but I’ll use CROS to cover both unless necessary to differentiate). When I did my masters degree, it was explained to us in our hearing aid class, but I was told not to worry about learning it too much because I’d maybe run into 1-2 candidates per year. Not too long after I graduated Telex sold their hearing division off and opened up the patent for wireless CROS. Phonak, Unitron and Interton all developed their own system (around 2004). We did our own internal studies and found, at the time, Unitron to be the best (n=35; 94% preference for the Unitron WiFi). Then Phonak introduces what I call the “Target” CROS (so called because that was the new software platform it used). We repeated the previous study, and this time it came out in favor of Phonak (n=25; 60% preference for Phonak Target CROS). With the advent of the Widex CROS, I’m thinking to repeat it again this summer (vs. Target).
As such, I’ve actually developed a significant specialty in this area, our office having fit about 300 systems since 2004, myself doing about 60% of them. I’m not sure what’s in the local water, but we see a lot of candidates for it. I’ve developed a presentation for “Solutions for Single-Sided Deafness” that’s been presented at IHS and a few state meetings. This is a shameless plug for me in case anyone in the audience is in leadership for a state organization and would like a presenter.