The Origin of Scientific Prescriptive Fitting

In the late 1950s, while audiologists were recommending hearing aids to be sold by and fitted by hearing aid “dealers,” a fitting approach was introduced that was based on science rather than on historical practice, supposition, and trial and error. It was called otometry.
Otometry, the “prescription of hearing aid instruments,” was developed by John Victoreen, L.L.D, a self-taught physicist, engineer, inventor, and owner of the Victoreen Instrument Company in Cleveland, Ohio{{1}}[[1]]Victoreen, J.A. (1960). Hearing Enhancement, Charles C. Thomas, Springfield[[1]].
Victoreen retired from the field of radiation physics in 1950, and devoted his research efforts to hearing enhancement starting in 1953. He founded the Vicon Instruments Company in Colorado Springs, a manufacturer of hearing aids and hearing-related equipment. Victoreen developed otometry in the absence of any universally-accepted hearing aid fitting procedure at that time (and interestingly, still today). He attempted to provide a scientific explanation and approach to fitting hearing aids that would bring all the disciplines together; audiologists, hearing aid dealers, and otologists, using sound pressure as the basis.
Author’s Note
Over the years, I have not found a single source that graphically explains the details of Victoreen’s procedure in a systematic manner, showing its step-by-step use with patients, and explaining each step of the process clearly. This summary of otometry is an attempt to provide that information for historical purposes. If something appears incorrect or missing, I ask for corrections to be forwarded to me so that I can add them to my Victoreen file, which is rather substantial. Uses and interpretations of otometry have been made throughout the years, which seems to have contributed to some confusion over otometry’s procedures. This post is neither an endorsement nor condemnation of otometry, but primarily an historical perspective.
Victoreen was not alone when investigating the use of sound pressures instead of hearing loss in dB to explain hearing aid fittings. A couple of notable early hearing aid selection techniques that appear to have utilized certain concepts from otometry, are those by Wallenfels{{2}}[[2]]Wallenfels, H.G. Hearing Aids on Prescription, Charles C. Thomas, Springfield, IL., 1967[[2]] and Pascoe{{3}}[[3]]Pascoe, D. An approach to hearing aid selection, Hearing Instruments, 29(1978), 12-16, 36[[3]].
Otometry
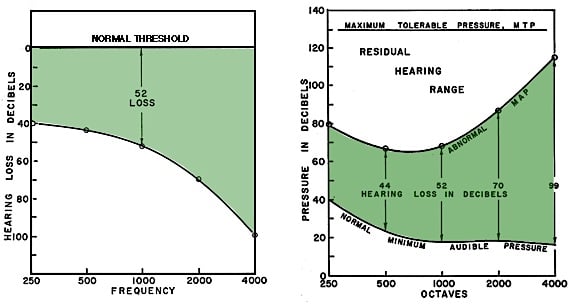
To find the best hearing instrument for a hearing-impaired ear, Victoreen felt that it was important to first measure the prosthetic need based on normal ear performance. The prosthetic device (hearing aid) should help to make the impaired ear behave as if it were a normal ear. If the relationships between frequency, sound pressure, and loudness in a normal ear were known, a logical attempt could then be made to restore these relationships in an impaired ear. This formed the basis for otometry.
Interestingly, otometry was not readily accepted by the “hearing professional” community. I have always suspected that it was because the approach and technology was developed by someone from outside “audiology,” and, worse, from someone in the “hearing aid industry.” Additionally, otometry involved physics and acoustics, areas that early audiologists were not all that comfortable with because most had backgrounds primarily in the social sciences. I recall specifically how audiologists sought to discredit otometry, almost without exception, but also without having investigated it themselves. Audiology was functioning as a behavioral science at the time and generally not exposed to the principles of physics. Hearing aid dealers also shied away from otology because many had little or no education in physics and acoustics – often having come from retail sales. The main points of contention between otometry and audiology were:
1. Victoreen believed the audiogram to be not a part of the hearing aid fitting, but a tool for the measurement of hearing loss. To audiologists, and to many hearing aid dispensers, the audiogram was the tool leading to hearing loss identification, and hence could not be separated from the hearing aid as a solution. After all, one had to know what the hearing loss was in order to provide help with amplification. Besides, much was invested in audiometers and the measurement of hearing sensitivity, plus a fitting philosophy based on “fitting the audiogram” (hearing loss). That was essentially the training of those who fitted hearing aids. Additionally, the fitting of hearing aids was almost an ancillary activity, and something that many audiologists did not participate in at that time.
Otometry prescribed that hearing loss in dB (relative audiometric measurement) could not be considered in any way for prosthetic purposes because a hearing instrument should apply sound pressure to hearing that remains, not to that which is lost.
Basic otometric principles were not intended to be at variance with basic audiological principles, but audiology did not see it that way. The reason is perhaps because otometry also believed that subsequent audiological evaluation would not be able to improve upon a proper otometric prescription.
2. Otometry did not focus on intelligibility. Although word recognition scores and phonetically balanced words lists could be valuable in finding out how well a prescribed instrument helps the user, they could not determine or predict the properties of an instrument that must be made to be most useful for the deficient ear. “Traditional hearing aid evaluation” as practiced then was developed in military rehabilitation centers following World War II. The approach consisted of essentially comparing aided speech reception and discrimination test results and subjective preference for several different hearing aids and making a selection on that basis.
Figure 1 is provided as a reference chart to assist in comparing otometry and audiometry, including how the various sound pressures in decibels used in connection with hearing instruments are related to each other. For example, basic sound pressure in microbars is shown on the extreme left of the chart. Any line drawn horizontally across the chart from left to right shows the relation of microbars to some other description in decibels at a particular frequency.
At about 0.36 microbar, the applied sound pressure in decibels is 65 re 0.0002 microbar (65 dB re 0.0002 dynes/cm2 or 65 dB re 20 µPa). At 1000 Hz, 65 dB is roughly considered the normal range center and also the approximate pressure at which the 1000-Hz components of speech are normally received.
The series of curved lines represent equal loudness contours – meaning that for a normal listener’s most comfortable loudness (MCL) at 1000 Hz, the sound pressure to reach that level would be about 65 dB SPL. At 500 Hz, the sound pressure to reach MCL would be about 83 dB SPL (follow the curved line). The actual SPL varies to produce equal loudness, depending on the frequency.
Normal Range Center – The “normal range center” of most comfortable loudness pressures is roughly fixed at about 65 dB SPL at 1000 Hz when measured under earphones, but 72 dB SPL when measured in a sound field (Figure 2). And, it is the latter that is most significant because both the normal ear, as well as an aided ear, operate in the sound field. As a result, otometry is based on sound field performance at most comfortable loudness. (In this series of posts, the terms “free field” and “sound field” will be used interchangeably). Figure 2 also represents the uncluttered graph (otogram) used for otometric testing. However, because of upward spread of masking, a preponderance of low-frequency environmental noise, and relatively lesser importance of low frequencies below 750 Hz for speech discrimination, low-frequency most comfortable loudness pressures (MCLPs) were adjusted. The MCLP values were rolled off 3-dB/octave for each 10 dB of in-use gain below 1000 Hz (solid line). This line serves also as the amplified listening objective.
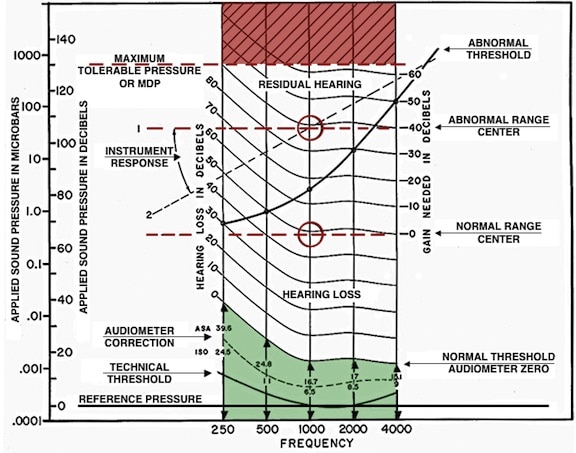
Figure 1. Otometric chart upon which all of the usually described measurement values of this post are shown in proper relation to each other. This chart was designed at a time when audiometers were calibrated to ASA Standards. For use with current Standards values (ANSI S3.6), all curved lines would be changed to conform to the dashed line shown under “audiometer correction.” This dotted line curve is plotted for audiometric ISO corrections, but is close to current pressures required for audiometric zero, and sufficiently similar for purposes here. The “abnormal range center” changes depending on the “abnormal threshold.” It approximates the midpoint of the dynamic range at 1000 Hz. On the other hand, the “normal range center” is roughly fixed at about 65 dB SPL at 1000 Hz when measured under earphones, but 72 dB SPL when measured in a sound field. And, it is the latter that is most significant because both the normal ear, as well as an aided ear, operate in the sound field. As a result, otometry is based on sound field performance at most comfortable loudness.
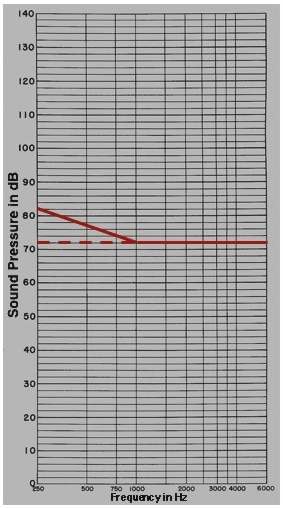
Figure 2. Free field (FF), or sound field Most Comfortable Loudness Pressure (MCLP) for normal listeners (flat line at 72 dB SPL). However, because of upward spread of masking, a preponderance of low-frequency environmental noise, and relatively lesser importance of low frequencies below 750 Hz for speech discrimination, low-frequency adjusted MCLPs were rolled off in the low frequencies to illustrate the unaided norm and the aided expectation.
Next week’s post will describe the basic concepts of otometry utilizing a series of illustrations.