This post continues a series on the origins of initial sound quantification. Last week’s post related to how the speed of sound was measured. This week continues with frequency analysis and amplitude.
Frequency Analysis of Sound
The Italian scientist Galileo (1564-1642) pulled a knife blade across the serrated edge of a coin and noted the tone it produced. From this, he theorized that sound was a sequence of pulses. Pulling the knife blade more quickly produced higher tones, and he realized that higher tones require a faster train of pulses.
Savart’s Wheel (or, The bicycle card trick)– In 1676, the great British scientist Robert Hooke (1635-1703) described in his diary a sound-producing machine, and demonstrated it to the Royal Society in 1681. It was similar to holding a playing card against the spokes of a spinning bicycle wheel and listening to the sound produced. Hooke had a toothed wooden wheel that was rotated as a card or reed was held against it. He noticed that a regular pattern of teeth produced musical sounds, and that irregular teeth produced something that sounded more like speech. Hooke’s work on this was not published until 24 years later, and was not used in another study for 150 more years.

Figure 1. Savart’s Wheel used to measure frequency. Actually invented by Robert Hooke, Savart added a mechanical tachometer and calibrated a rotational scale with the tooth rate, demonstrating for the first time specific tones associated with specific frequencies.
By 1834, the French scientist Felix Savart (1791-1841) was building giant brass wheels. However, he added a mechanical tachometer connected to the axis of the toothed wheel (Figure 1). He calibrated a rotational scale with the tooth rate, and demonstrated for the first time specific tones associated with specific frequencies. Savart could determine the frequency of a tone heard by using his ear to match it with the toothed wheel, then reading the frequency from the tachometer. In essence, he was using his ear and brain to do what a modern electrical engineer would call heterodyne analysis. Interestingly, these great toothed wheels, the part invented by Hooke, are today called “Savart’s wheels,” but Savart’s contribution, the tachometer, is forgotten.
Tuning Forks – A magnificent invention occurred in Britain in 1711 that would be applied to acoustics, music, and medicine. In acoustics, it would be the basis of two centuries of measurement. It was the tuning fork (Figure 2), invented by John Shore (1662-1752). John Shore was sergeant-trumpeter to George I. The tuning fork created a frequency standard that we can still refer to today. The tuning fork became so widely used as a scientific instrument that by the end of the 19th century, Karl Rudolph Koenig (1832-1901) was building tuning forks with tines 8 feet long and 20 inches in diameter. Koenig also built clocks that used ultra-accurate tuning forks to drive the escapement, a concept that was incorporated into wristwatches in the 1960s.

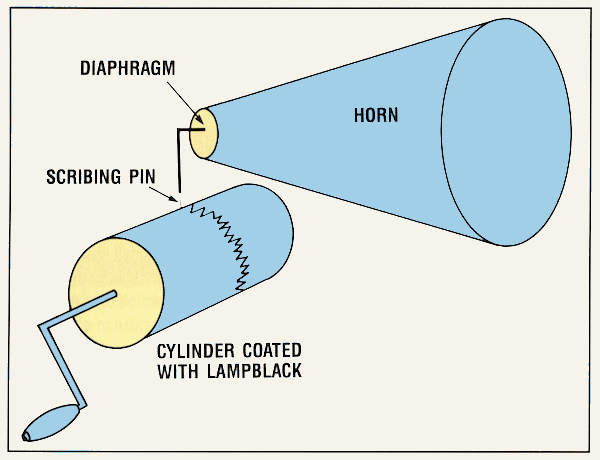
Figure 2. The Phonautograph. Sound waves are scratched into the lampblack coating of a rotating glass cylinder as a person shouts into the megaphone. The megaphone is terminated at the small end with a diaphragm that has a small pin pushed through it that serves as the writing stylus.
Phonautograph – In 1807, Thomas Young (1773-1829) coated a glass cylinder with lampblack, pushed a pin through a flexible diaphragm and, by shouting into a horn with the diaphragm at the narrow end (Figure 2), was able to see the sound waves scratched into the lampblack. Léon Scott, a Frenchman, elaborated on this idea. He used the ears of decapitated dogs to serve as the receiving horns to amplify the sound waves. He placed a small feather across the distal side of the ear and, with a sharpened tip of the feather, “wrote” sound waves in the lampblack on the cylinder. Scott demonstrated this in 1854, calling it the phonautograph. Later versions looked very similar to Edison’s phonograph 20 years later.
Lissajous Patterns – Manufacturing tuning forks became an industry, but there was no way to quickly provide absolute accuracy in comparing a new tuning fork against a standard fork. A comparison could be made by ear, of course, but that technique was difficult in the noisy environment of a metalworking factory. This problem was solved in 1854 by the Frenchman Jules Antoine Lissajous (1822-1880) using an optical method of great elegance.
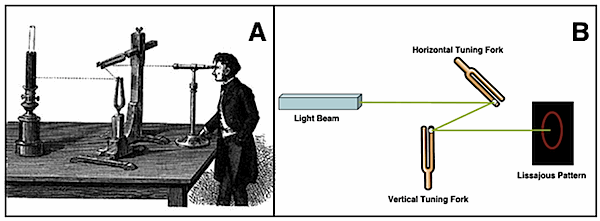
Lissajous turned two tuning forks at right angles to each other so that one vibrated horizontally and the other vibrated vertically. He shined a beam of light onto a tine of one fork and reflected that light beam onto the tine of the other fork, and visually observed the resulting looping pattern (Figure 3). These patterns, named for Lissajous, showed relative frequency, amplitude, and phase. This was essentially the first oscilloscope – albeit a mechanical model. Prior to the availability of modern instruments of various types, with high-speed digital signal processing and capable of extracting real time information from signals of interest, the oscilloscope was the mainstay electronic instrument to investigate electronic signals representing diverse parameters. The electronic oscilloscope projects a beam of electrons onto a fluorescent screen (similar to early TVs or computer monitors). The beam is scanned across the screen linearly with time. The oscillating electronic signal is amplified and used to deflect the beam vertically. The result is an amplitude versus time display of the signal.

Figure 3. Lissajous patterns. Lissajous’ measurement illustration (A), and artist rendering (B). Light patterns are obtained by shining a light onto a very small mirror attached to a single tine of a vertical tuning fork, and having it reflected off the single tine (small mirror attached), of a horizontally oriented tuning fork. The resulting looping pattern is called a Lissajous pattern. Multitudes of patterns can be reflected onto a surface, the patterns dependent upon the frequency, phase, and amplitude of the reflected light beam. This formed the basis of the electronic oscilloscope.
Amplitude of Sound
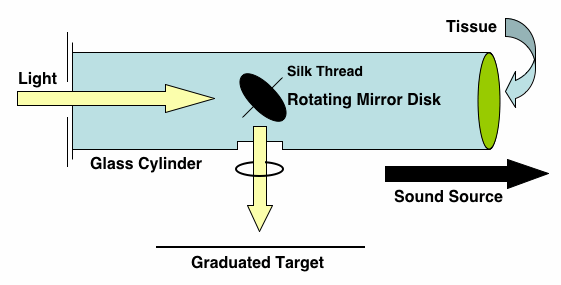
In the historical development up to this point, the sound attributes of speed, frequency, and phase have been discussed. These were hard-earned measurements, but one was missing – that of amplitude. It was not until 1882 that an instrument was developed for measuring the quantity of sound. It was then that Lord Rayleigh (1842-1919) put a small, reflective disk in a glass tube so it could pivot along a diameter. One end of the tube was open, but with a tissue placed across it so that random drafts could not confuse the apparatus (Figure 4).

Figure 4. The Rayleigh disk. A small pivoting reflective disk in a glass tube would rotate proportionally to the particle velocity of sound waves in the glass tube. A light beamed onto the disk would allow its rotation, and thus, amplitude of the sound wave to be measured.
The disk would rotate proportionally to the particle velocity of sound waves in the glass tube. This was a direct measure of volume-velocity, the acoustic analog of electric current. By shining a beam of light onto the disk, he could measure its rotation and thus, the amplitude of the sound wave. Although the Rayleigh disk was a great breakthrough, it had practical problems. Its use was limited essentially to the laboratory under tightly controlled conditions, and only with well-trained technicians.
Just about the time that the Rayleigh Disk was introduced, some seemingly unrelated inventions made elsewhere would bring to an end the era of mechanical sound measurements.
The Electrical Era
In 1876, Thomas Edison (1847-1931) invented the carbon button microphone. But, finding no use for it, he casually licensed it to Western Electric for use in the telephone.

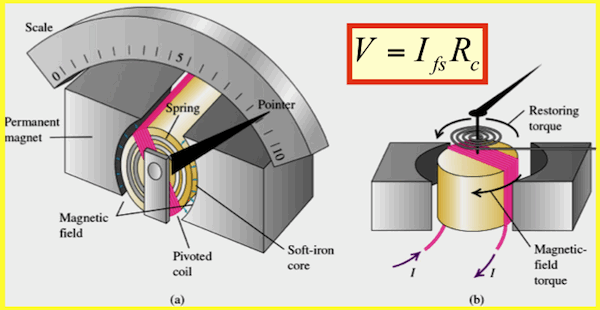
Figure 5. d’Arsonval galvanometer. A coil of wire connected to a pivoting needle is surrounded by a large magnet. Tiny currents in the coil deflect the needle.
Galvanometer – In 1882, the same year that Rayleigh introduced his disk, a French medical physician, Jacques-Arsène d’Arsonval (1851-1940), was seeking a way to measure the tiny electrical currents in the human body. He connected a coil of wire to a pivoting needle and placed a large magnet around it (Figure 5). Tiny currents in the coil would deflect the needle. He called this device the galvanometer, named in honor of Luigi Galvani (1737-1798), who made a frog’s leg jump by applying an electric current.
Western Electric had taken over AT&T (Alexander Graham Bell’s organization) by 1908, and George Washington Pierce (1872-1956) connected a carbon button microphone to a galvanometer meter movement and measured sound electrically. Even though the carbon microphone was very unreliable (susceptible to temperature, humidity, and maybe even moon phases), it ushered in the end of mechanical measurement instruments.
The electrical era began in earnest in 1917 when Western Electric engineers combined four inventions for practical, reliable, sound measurements. These were the 1) electrostatic microphone, or condenser microphone in 1924, 2) the thermophone, which was used to calibrate the condenser microphone, 3) the vacuum tube invented by John Fleming, Lee de Forest, and Edwin Armstrong, and 4) the display of the amplified signal from d’Arsonval’s galvanometer.


