
Consumer Preferred Hearing Aid Signal Processing Scheme vs. Audiologists’ Recommendations
Last week’s post wondered about how satisfactory a hearing aid fitting was for consumers when they leave the dispenser’s office. Was it the optimum fitting, or would some other hearing aid signal processing scheme (also herein referred to as algorithms) have been more acceptable? Would there be any differences in the final signal processing preference if the consumer were allowed to select the hearing aid basic operational system as opposed to that selected by the dispenser? Would their preferences change after two weeks to two months? Recall that these are not selections for environmental condition listening, but for completely different signal processing schemes – meaning, completely different hearing aids.
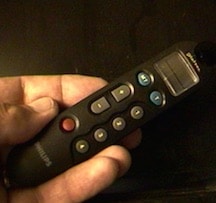
This week’s post provides some of the results when subjects (consumers) are allowed to select, using paired-comparisons, from four completely different signal processing schemes in a single system (BTE hearing aid and a hand-held remote muilti-programmer holding the different signal processing schemes). The reader is referred to last week’s post for a more detailed description of the signal processing schemes used.
Eleven experienced audiologists were involved in making a recommendation from among the four signal processing schemes for each subject. These recommendations were based on the subject’s audiogram (Figure 1) and interview to determine their listening needs. Subjects wore the hearing aids (as allowed by the multi-remote programmer) during their normal amplification schedule (all but one was an existing hearing aid wearer) and made paired-comparisons of all four algorithms. Subject preferences were conducted prior to two weeks (considered initial preference), and then after two weeks to two months for a second preference. Additionally, subjects were asked to identify their preferences for the signal processing algorithm (Fidelity, Comfort, Clarifier, Equalizer) under different environmental listening conditions (noise, quiet, music, etc.).
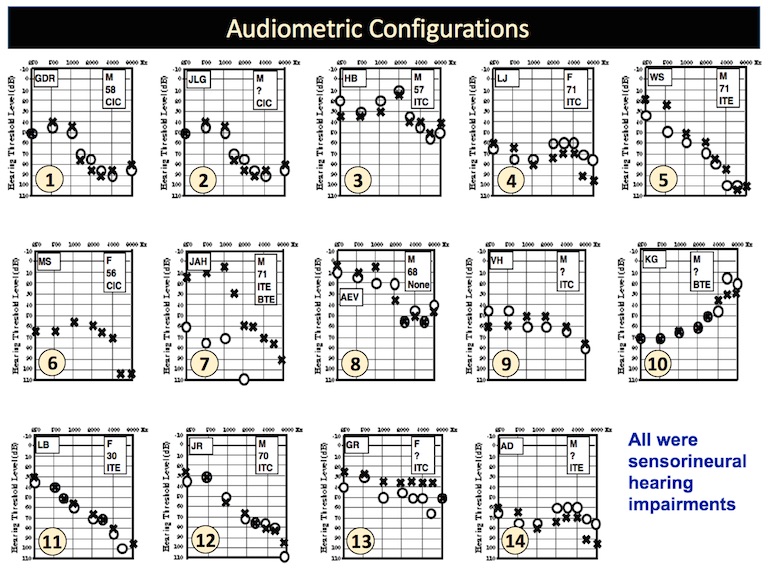
Figure 1. Pure-tone air-conduction thresholds for the fourteen subjects. All subjects were evaluated as having sensorineural hearing, and therefore, no bone-conduction thresholds are shown.
Figure 2 shows the signal processing algorithm recommended by the eleven different audiologists (column C) and the final hearing aid signal processing scheme at the end of two months preferred by the subject (column A). Column B indicates the signal processing schemes (algorithms) used in this study. For example, for subject No. 1 (corresponding to No. 1 of the audiograms in Figure 1), no audiologist recommended the Fidelity algorithm, five audiologists recommended the Comfort algorithm, one recommended the Clarity algorithm, and five recommended the Equalizer (total of eleven audiologists). At the end of the two-month study, subject No. 1 preferred the Comfort algorithm. The same process can be followed with each of the subjects.
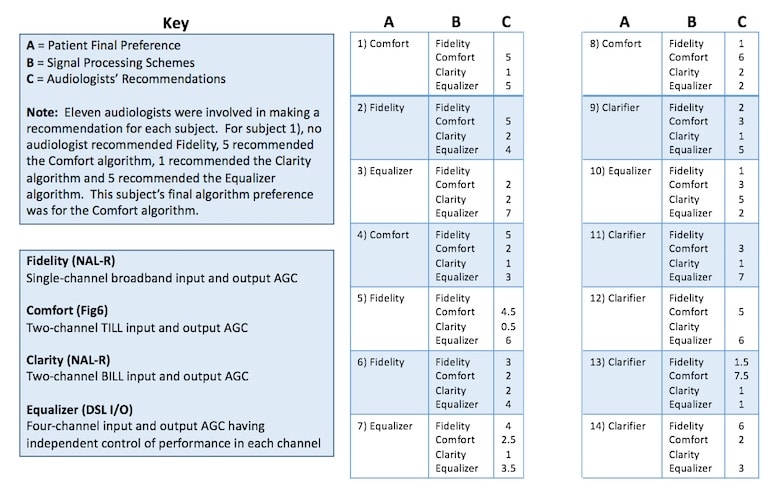
Figure 2. Result of subject final algorithm preference versus the recommendations made by eleven audiologists.
Results in Figure 2 show that when subjects are allowed to select from different hearing aid processing schemes, as described in last week’s Part I of this series (not just different environmental selections, as provided by most hearing aids currently on the market), considerable differences exist between the audiologists’ recommendations, and the final preferred algorithm by the subject. Also interesting is the recommended algorithm differences for the initial recommendations for the same subject by each of the eleven audiologists.
Next week’s post will provide information about individual preferences during the time period of the study.


Some how this doesn’t suprise me, they are our ears – just let us have the buttons.