

Amyn Amlani, PhD, has co-written the 2016 Pricing Update series in Hearing Economics. Today’s post concludes the series for this year.
In the 1937 Disney classic movie, Snow White and the Seven Dwarfs, the Evil Queen stands in front of a mirror and pronounces, “Magic mirror, on the wall – who is the fairest one of all?” As we conclude the 2016 posts on pricing, we believe all dispensers should summon the spirits from the future, and look into the proverbial mirror to gain a better understanding of price and adoption.
Just as the Evil Queen was shocked to learn that she was not “the fairest in the land,” many professionals will display a similar reaction to learn that price is not the key, or evil, factor when an impaired listener decides to adopt (or not adopt) audiological services and technologies. In this post, we examine the psychological concept of perceived value, and its impact on the profession.
Trade-Off between Benefits and Sacrifices
In 1979, Monroe1 hypothesized that consumers cognitively rationalized two key factors when deciding to adopt a service, product, or both: (1) quality and (2) price (see Figure 1). For consumers, the perception of price is drawn from the retail (i.e., actual) price, usually obtained online or through newspaper ads, and the price they anticipate spending towards the service or product. The perception of quality for a service or product stems from consumer’s assessment of the product to satisfy its intended purpose, relative to alternatives (e.g., hearables) and previously purchased products. Together, the consumer’s perceived price and perceived quality formulate value perceptions (i.e., perceived value), which is the key construct to influencing choice. Thus, increases in perceived value increase the likelihood of purchase intent, while decreases in perceived value decrease the likelihood of purchase intent.
Theoretically, the consumer’s overall assessment of the utility of a service or product is dependent on the relationship between what is received and the price paid. In audiology, we have posited the attitude that higher retail prices are associated with higher quality services and products. Unfortunately, as a profession and industry, we have failed to deliver on this stance. We justify this statement by evaluating a service and product components.
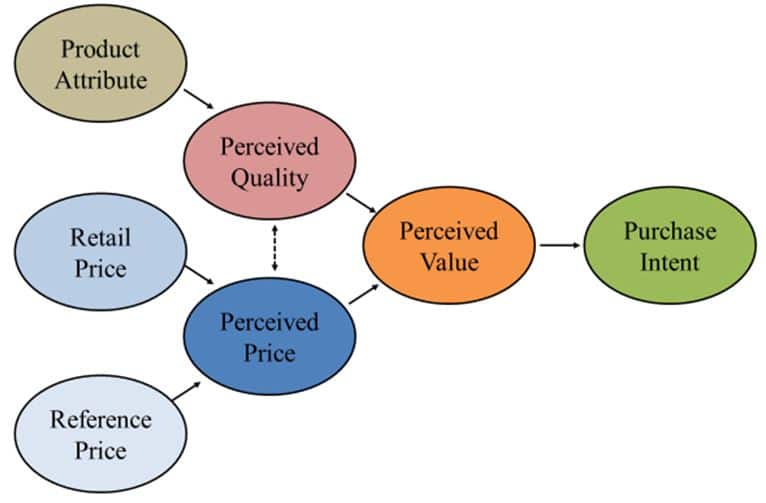
Figure 1. Relationship between quality and price as it relates to perceived value and, ultimately, purchase intent.
WYSIWYG
WYSIWYG (pronounced “wiz-ee-wig“) stands for “what you see is what you get,” and is a software application that enables the end user to see the display screen exactly as it will appear when the documented is printed. When it comes to clinical service delivery, unfortunately, audiology has subscribed to the acronym: WYSINWYG (hint: The N represents “not”). As an example, let us look at the service provision associated with hearing aid service delivery (i.e., real-ear measures).
Surveys indicate that only 20% to 50% of audiologists provide real-ear measures as a service to their patients.2,3 One reason for the low use of real-ear measures is the reliance by clinicians on the manufacturer’s software to use Quick-fit. While research has shown that Quick-fit differs from prescriptive targets by as much as + 10 dB,4 it was unclear whether impaired listeners in the studies were perceptive towards the services they were receiving.
In a recent study,5 we quantified the perceived value of hearing aid service delivery in three groups of listeners:
- experienced with amplification (i.e., > 1 year of use)
- purchased hearing aids previously, but the devices are not being worn (i.e., hearing aids in-the-drawer)
- first-time users of amplification
We used the metric of willingness-to-pay (i.e., WTP). WTP is a single question which queries the psychological maximum dollar amount an individual is willing to exchange to obtain a service or product. Prior to querying each group, we provided each participant with a price anchor of $250 for professional services, which we found to be the average hourly rate6 in a US audiology clinic (i.e., dashed line in Figure 2).
Results, shown in Figure 2, indicate unequivocally that the average listener, regardless of experience with amplification, is perceptive towards the services they receive from the professional. Instances where the perception was poor—with Quick-fit—oftentimes resulted in no further adoption of audiological services or amplification. The use of Quick-fit as a professional behavior is conjectured to be a primary contributor to the 6-to-12-year delay by first-time users willingly entering the market.
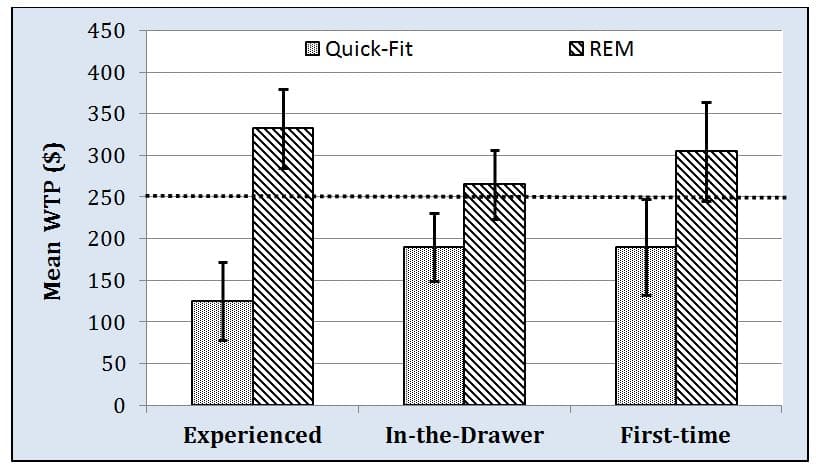
Figure 2. Group responses of willingness-to-pay (i.e., WTP) for hearing aid services provided by an audiologist using Quick-fit and real-ear measures (i.e., REM).
Multichannel Compression: Mercedes Benz or AMC Pacer?
Hearing aids are engineered with different levels of technology, and marketed and dispensed based primarily on the number of channels. In this model, fewer channels is equated with a lower retailer price, while devices having an increased number of channels equates to a higher retail price. For the consumer, higher retail price is associated with a higher quality product. Unfortunately, this conjecture is not supported by the literature. In fact, in December 2015, a two-part post (Part 1 and Part 2) was posted on HHTM that discussed these issues. The reader is urged to access these blogs for greater detail.
Briefly, it has been shown that a vowel processed through a hearing aid with an increased number of channels results in a flattening of the peak-to-valley ratio (i.e., spectral contrast) of that vowel/s formant structure (Figure 3). As the number of channels increases, there is greater flattening effect, which has been shown to degrade aided speech-recognition performance.
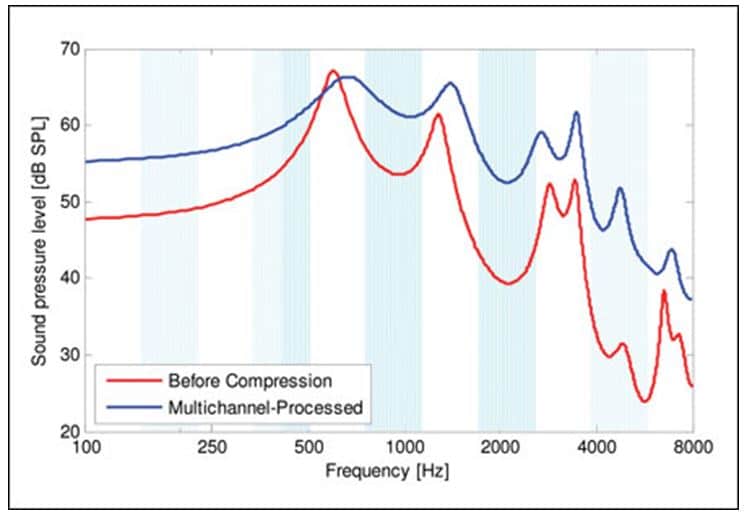
Figure 3. An illustration of the speech envelope for the vowel /u/ for an unamplified input signal (in red) and the signal processed in a multichannel WDRC device (in blue). Adopted from Schaub (2009).7
Behaviorally, listeners with reduced audibility are able to discriminate the changes in speech envelope as a function of differing numbers of channels. In a recent study, listeners with impaired hearing provided their willingness-to-pay, measured as clarity (i.e., cleanliness, undistorted), of a control condition (i.e., unaided speech passage recorded through KEMAR) and five experimental conditions (same speech passage recorded through KEMAR fit with different amplifying devices differing in the number of channels). The unaided condition was price anchored at $2000, the approximate retail price of a single unit in the United States.
Figure 4 shows that the willingness-to-pay for the smartphone app (9-channel) and economy line hearing aid (6-channel) conditions were not statistically different from the undistorted reference condition of KEMAR, while the remaining three aided conditions (i.e., HA 16-channel, HA 20-channel, PSAP 16-channel) yielded statistically lower mean willingness-to-pay compared to KEMAR. However, the real story line here is that the premium hearing aid (i.e., 20-channel product) yielded the lowest mean willingness-to-pay of any device (including the smartphone app and a PSAP) and the economy hearing aid (i.e., 6-channel product) resulted in the highest aided mean willingness-to-pay.
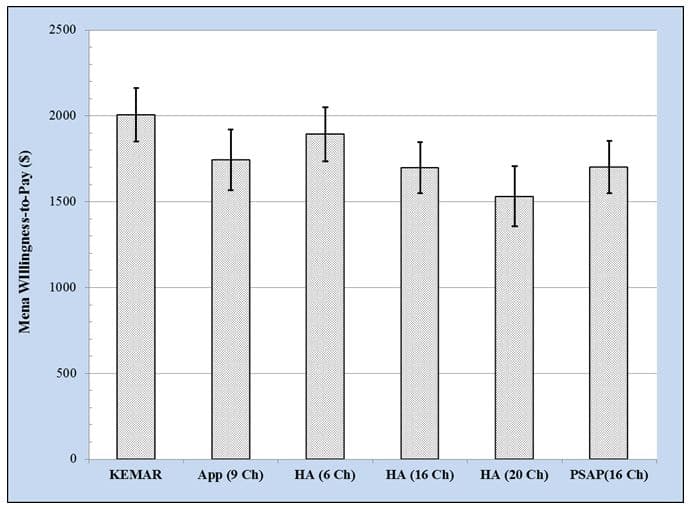
Figure 4. Willingness-to-pay across amplification devices differing in the number of channels. (Ch = channels; App = smartphone-based hearing aid application; HA = hearing aid; PSAP = personal sound amplification product). Adopted from Amlani et al (unpublished).8
Overall, impaired listeners in this sample heard sound quality differences, which influenced their perceived value. This data is akin to the classic cruising scene in the movie, Wayne’s World, where Mike, Garth, and a few buddies head-bang in their AMC Pacer to Queen’s Bohemian Rhapsody. Not exactly the Ferris Bueller’s Day Off cruising scene we all wish for.
Mirror, Mirror…
While this series of posts has shed light on pricing trends within the profession and industry–which are critical to the economics of day-to-day business operations–audiologists and industry professionals must acknowledge that price alone is not the primary factor that has suppressed adoption rates for the past 40 years. When the profession looks at itself in the mirror, it will see that the primary catalysts impeding growth in this market is itself.
The image in the mirror may not be what the profession desires, but with a healthy diet of evidence-based practices, increased research and continuing education, and an overhaul in the education of future professionals at the university-level, there is still time, at a future date, for the magic mirror to shout out “…Audiology is the fairest of them all!”
This is Part 8 of the 2016 Hearing Aid Price Series update. Click here for Part 1, Part 2, Part 3, Part 4, Part 5, Part 6, and Part 7.
References
- Monroe, K.B. (1979). Pricing: Making Profitable Decisions. New York: McGraw-Hill.
- Mueller HG, Picou EM. (2010). Survey examines popularity of real-ear probe-microphone measures. Hearing Journal, 63(5), 27-28, 30, 32.
- Sanders J, Stoody T, Weber J, Mueller HG. (2015). Manufacturers’ NAL-NL2 Fittings Fail Real-ear Verification. Hearing Review, 21(3):24.
- Aazh H, Moore BC, Prasher D. (2012). The accuracy of matching target insertion gains with open-fit hearing aids. American Journal of Audiology, 21(2):175-180.
- Amlani AM, Pumford J, Gessling E. (in press). Improving patient satisfaction and loyalty through real-ear measurements. The Hearing Review.
- New data, derived from Amlani AM, Aird J, Freeman BA, Taylor B, Yanz J. (2016, Spring). ADA 2014 practice trends survey: Performance indicators to compete in a disruptive market. Audiology Practices, 10-14.
- Schaub A. (2009). Enhancing temporal resolution and sound quality: A novel approach to compression. Hearing Review, 16(8), 28-33.
- Amlani AM, Cavitt K, Corral-Molina M, Crawford K, Sancer L. (unpublished). Making sense of hearing aid pricing tiers and user perceptions.

Amyn Amlani, PhD
Co-editor Amyn M. Amlani, Ph.D., is Professor and Chair of the consortium program in Audiology & Speech Pathology between the University of Arkansas for Medical Sciences and the University of Arkansas at Little Rock. Dr. Amlani holds the B.A. degree in Communication Disorders from the University of the Pacific, the M.S. degree in Audiology from Purdue University, and the Ph.D. degree in Audiology/Psychoacoustics (minor in Marketing and Supply Chain Management) from Michigan State University. His research interests include the influence of hearing aid technology on speech and music; economic and marketing trends within the hearing aid industry; and playing bass guitar in various heavy metal cover bands. Email: [email protected]
feature image courtesy of interiormad