
Statistical Shape Modeling of the Human Ear Canal
 This post is a continuation of methods that have been used to determine the dimensions of the human ear canal. The approach described in this post uses a process called active shape analysis. This process has been used in describing, identifying, and segmenting biological shapes, but not previously for ear canals. Because of its complexity, this post is specific to this complex method of attempting to determine ear canal shape.
The procedure attempts to determine the configuration of the human ear canal using dense surface point distribution modeling. Essentially, ear impressions are laser scanned, a limited number of marks are placed on the resulting scans to identify significant, replicable, and stable anatomical landmarks, and then a template mesh is warped onto shapes determined from the scanning and marking. This approach is intended to provide a rough estimate of the ear canal configuration. A major limitation is that a complete surface area of the ear canal is not displayed because the ear canal opening is not closed, and because the scanned ear impressions do not provide a complete ear canal (the area of the tympanic membrane is excluded when taking traditional ear impressions).
The following explanation is based on a method performed at the Informatics and Mathematical Modelling, Technical University of Denmark, and presented as a conference paper in Japan.
Overview:
- Ear impressions are taken and form the basis for 3D scanning. A limitation is that the ear impressions are not of a complete ear canal, rendering the process interesting and potentially useful, but incomplete.
- 3D-surface scans of the impressions are made using a laser scanner.
- “Landmarks” (a series of dots) are placed on the ear canal. The placement of landmarks is based on assumptions, because very few ridges and external points are stable when comparing groups of ear canals. These landmark assumptions form the entire basis of the statistical model. Because only a limited number of dots are available to represent “stable” anatomical positions of ear canals, interpolation of additional landmarks is undertaken – a very difficult task using 3D imaging.
- A template mesh is deformed to each shape using a thin plate spline (TPS) transformation method, based on the annotated landmarks, and thus creating a training set of shape models
- This is followed by a regularization step where each vertex of the template mesh is adapted to the current shape without causing folds.
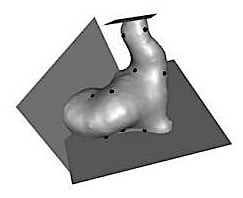
Figure 1. An example of a surface representation of an ear canal with anatomical landmarks and the separating planes that defines the region of interest (Paulsen et. al, 2002).
Specifics:
- A set of 29 ear impressions was taken from 20 male and 9 female subjects.
- The ear impressions were scanned and shown in Figure 1. This also shows 9 of the 18 annotated landmarks, identified by the black dots.
- Anatomical landmarks were annotated. Eighteen anatomical landmarks were placed on each ear canal. The separating planes in Figure 1 were placed to identify invalid areas (incomplete or open ear impression areas).
- A template mesh is constructed. With only 18 anatomical landmarks defining the shape of the ear impression, an exhaustive description of the ear canal surface cannot occur. It is therefore necessary to generate a denser set of landmarks describing the shape. This was accomplished by constructing a template mesh that could be applied to all shapes in the training set. The template mesh was made from one of the actual ear canals in the training set.
- The anatomical landmarks and the template mesh are then used to

Figure 2. A model mesh, shown by a wireframe, fitted to a target shape, using Thin Plate Spline warping.
establish a dense surface correspondence between the different shapes in the training set. The template mesh is applied to each of the shapes in the training set using a Thin Plate Spline (TPS)* warp based on the anatomical landmarks. However, the transform is exact only for the anatomical landmark locations, and as such, will not lie on the surface of the target shape. This can be seen in Figure 2. Moving each vertex in the warped template mesh to the closest point on the target surface completes the dense correspondence. The template mesh is then pruned to contain only the points that are warped to valid areas for all shapes in the training set. After this is done for each shape in the training set, a new set of meshes results. The anatomical landmarks as well as the original meshes of the training set are then disposed of, and the new set is used in a statistical shape analysis.
- Building the Point Distribution Model. The set of meshes are aligned, and from these, a pure shape model is built as a size-and-shape model determined from statistical analysis (right image in Figure 3).
- Observations from the shape model(s):
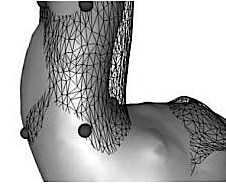
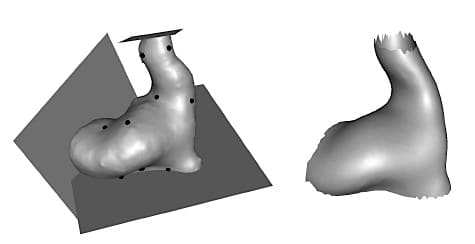
Figure 3. The left image is an example of a surface representation of an ear canal with anatomical landmarks and the planes that separate the valid from the invalid areas. The image on the right is an example of the average model shape from the mesh templates.
- Figure 3 shows the average shape based designated by the Point Distribution Model. It is on the right, showing it to be incomplete along the planes identifying invalid areas (areas where the ear impressions were incomplete).
- Three modes of variations of the pure shape model are seen in Figure 4, and can be compared with the average shape model on the right of Figure 3.
- The validity and usability of the shape model was tested to determine if it could reflect gender differences in the size and shape of ear canals. This was based on taking the square root of the distance from each landmark to the center of the mass, and using this number for comparison purposes. A standard t-test showed a significant difference in size between male and female ear canals, under this comparison procedure.
- Testing for a gender shape (unrelated to size) showed a difference, although not statistically significant, between genders.
Conclusions related to statistical shape modeling:
- The real significance of this attempt to determine human ear canal characteristics was in providing evidence of proof-of-concept regarding the ability to build a meaningful statistical shape model.
- Generalized ear canal shape can be statistically determined based on shape modeling.
- Because the modeling is based on conventional ear impressions that do not provide complete ear canal architecture, it cannot provide complete ear canal dimensional measurement values.
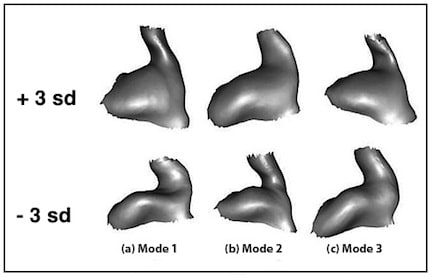
Figure 4. Size and shape model. The top three modes of variation are shown at +3 and the bottom three modes at –3 standard deviations from the mean shape.
A follow up on the same 29 ear impressions incorporated Markov Random Field (MRF) regularization to improve the shape of the model. This led to the generation of a model that produced highly homogeneous polygonized shapes and improved the capability of reconstruction of the training data (Figure 4). When the MRF regularization and PSP methods are compared, in excess of 4% variance reduction occurs using MRF (Figure 5). The primary intended use of this information was to assist in automated hearing aid component placement for custom-molded canal hearing aids.
Overall comment:
It appears that, currently, the historical method that provides the most reliable and usable approach to determining the dimensional characteristics of the human ear can come from direct physical measurements of ear impressions. However, 3D scanning from inside the ear canal should provide data to assist in mapping the ear canal dimensions with fine resolution. Lantos Technologies (3D ear scanning system), at the American Academy of Audiology 2014 meeting, reported on data demonstrating markedly better measurement consistency between direct ear scans compared to consistency of earmold impressions. (3D scanning will be discussed in a future post). A critical feature relates to variance in ear canal dimensions, something that statistical shape modeling is not expected to predict. This is important when ear canals have similar anthropomorphic characteristics.
*Thin Plate Spline, or TPS for short, is an interpolation method that finds a “minimally bended” smooth surface that passes through all given points. TPS of three control points is a plane, more than three is generally a curved surface and less than three is undefined. The name “Thin Plate” comes from the fact that a TPS more or less simulates how a thin metal plate would behave if it were forced through the same control points. Thin plate splines are particularly popular in representing shape transformations, for example, image morphing or shape detection/matching.
Reference:
- Paulsen, R., Larsen, R., Nielsen, C., Laugesen, S., and Ersbøol, B. (2002). Building and testing a statistical shape model of the human ear canal, in The proceeding of the Medical Image Computing and Computer-Assisted Intervention – MICCAI 2002, 5th International Conference, Tokyo, Japan, September 25-28, 2002, Proceedings, Part II
- Paulsen, R.R., and Hilger, K.B., (2003). Shape modeling using Markov Random Field Restoration of point correspondences. Information processing in Medical Imaging, p. 1-12
Wayne Staab, PhD, is an internationally recognized authority in hearing aids. As President of Dr. Wayne J. Staab and Associates, he is engaged in consulting, research, development, manufacturing, education, and marketing projects related to hearing. His professional career has included University teaching, hearing clinic work, hearing aid company management and sales, and extensive work with engineering in developing and bringing new technology and products to the discipline of hearing. This varied background allows him to couple manufacturing and business with the science of acoustics to bring innovative developments and insights to our discipline. Dr. Staab has authored numerous books, chapters, and articles related to hearing aids and their fitting, and is an internationally-requested presenter. He is a past President and past Executive Director of the American Auditory Society and a retired Fellow of the International Collegium of Rehabilitative Audiology.
**this piece has been updated for clarity. It originally published on June 30, 2014