
Illustrative Procedure (A simple scientific substitution method is employed)
 Introduction
When discussing topics that readers are somewhat unfamiliar with, it is helpful to provide a step-by-step description and explanation to assist in understanding the procedure. This is certainly desirable in regards to otometry. However, such a “walk-through” procedure is not found in either of Victoreen’s books on otometry or his published articles. It most likely was provided during individual training sessions and assuredly resides in the files of those who used the procedure.
Unfortunately, a review of the literature comes up essentially empty handed. What was located is consistent for the first steps, but provides confusing determinations of the actual gain required (the final step). I am certain that when going through some of my old files in the garage, when looking for something else, I will find the substantial notes provided to me by Dr. Victoreen many years ago that explain this discrepancy.
Illustrated Otometry Procedure
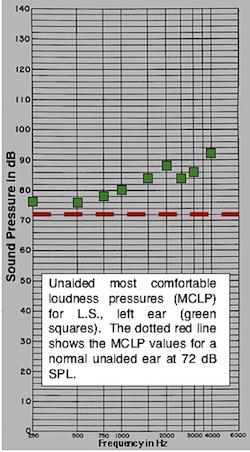
Figure 8. The unaided MCLPs (green squares) are greater than +6 dB of the 72 dB SPL MCLP for normal listeners (red dashed line) for this subject, indicating that amplification is recommended.
The numerical data for this illustrative purpose has been redrawn and modified based on an actual subject, and would vary for each subject{{1}}[[1]]Melen, L.A. Otometry: An emerging prosthetic discipline prescription selection and fitting of hearing instruments. The Guthrie Bulletin, Volume 47, Summer 1977[[1]]. The descriptive comments come primarily from other Victoreen publications{{2}}[[2]]Victoreen, J.A. The prescription of hearing aid instruments, Audecibel, Spring 1968, pp. 49-56, 58, 60-61[[2]]{{3}}[[3]]Victoreen, J.A. Hearing instruments and loudness, Audecibel, 1972, pp. 190, 191-194, 196-198, 200-202[[3]]{{4}}[[4]]Victoreen, J.A. Basic otometric principles, Audecibel, Spring 1973, pp. 63-70, 72-76, 78-79[[4]]. The procedure is as follows:
- Measure unaided MCLP (Most Comfortable Listening Pressure) using the damped wavetrain (DWT) signal (Figure 8 – figure numbering continues from the previous posts on otometry). If greater than +6 dB from the 72 dB most comfortable loudness pressure line (red dashed line), amplification is recommended.
- The earpiece intended for use is attached to a laboratory or test hearing aid and placed on the subject. (A laboratory standard aid is a normal hearing aid whose parameters can be modified as necessary by the manufacturer to fulfill the prescriptive measurements. This “substitution” of a standardized hearing instrument in place on the ear and operating at an approximately most-comfortable-loudness level, eliminates consideration of insertion losses that vary from patient to patient when fitted with amplification.
- Present the DWT signals from a loudspeaker at the appropriate distance (28 inches on axis, but could vary, depending on calibration). The signal repeats at a rate of 3/second. Measure each ear separately, occluding the contralateral ear during testing (Figure 9).
- Turn hearing aid on and obtain a MCL at 1000 Hz for a 72 dB SPL DWT signal (some adjustment of the hearing aid volume control is most likely necessary). This becomes the reference position.
- Measure range of comfortable loudness (too loud and too soft – usually about a ±4 dB range, with MCL about in the middle (I have found it more accurate and faster if the subject manipulates the level of the DWT signal to achieve these measurements by turning the attenuator knob themselves). This step, measuring the range from too loud to too soft is often eliminated, with the MCLP measured directly.
- Measure threshold of discomfort (Maximum Tolerable Pressure, or MTP) using the DWT signal (determines maximum deliverable pressure to not be exceeded)
- Measurement of the minimum audible pressure (MAP) is required only if one wants to review the actual dynamic range, or if one wants to estimate the MCLP by bisecting the MAP and MTP, a method sometimes used but not recommended.
- With the volume control of the hearing instrument set in the reference position, MCLPs at other frequencies are measured (Figure 10). Frequencies available with the DWT generator are 250, 500, 750, 1000, 1500, 2000, 2500, 3000, 4000, and 6000 Hz.
- Plot these data on the otometric tabulation chart (Figure 11, top line). Note that the 72 dB at 1000 Hz (outlined in yellow) represents the reference position as described previously and illustrated in Figure 9. The values at the other frequencies represent MCLP with the hearing aid set to the reference position.
- Turn hearing aid on and obtain a MCL at 1000 Hz for a 72 dB SPL DWT signal (some adjustment of the hearing aid volume control is most likely necessary). This becomes the reference position.
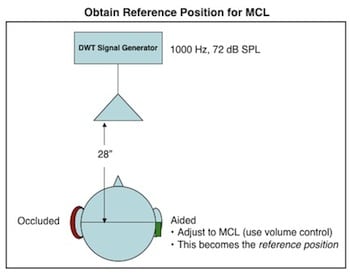
Figure 9. Arrangement for obtaining the reference position for MCLP (most comfortable loudness pressure). The damped wavetrain (DWT) signal is introduced into a free field by a loudspeaker. In this illustration, the right ear is being measured. All would be reversed to measure the left ear. A sound-treated room is not required.
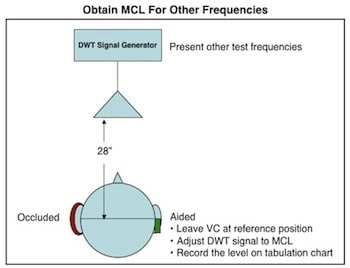
Figure 10. Most comfortable loudness pressures (MCLP) are measured for the other test frequencies using the damped wavetrain (DWT) signal. The volume control of the measurement hearing aid is not changed. The level of the DWT signal is adjusted to record the MCLP values for each of the other test frequencies.
The second line of the prescription tabulation chart of Figure 11 represents the MCLP objectives with the low frequencies rolled off at 3-dB/octave below 1000 Hz (Figure 12). Line 3 is the difference between lines 1 and 2. Line 4 values are taken from the 2cc coupler data of the measurement hearing aid used in the test (Figure 13), and line 5 (in blue) is the eventual hearing aid prescription gain for the different frequencies, added or subtracted, of lines 3 and 4.
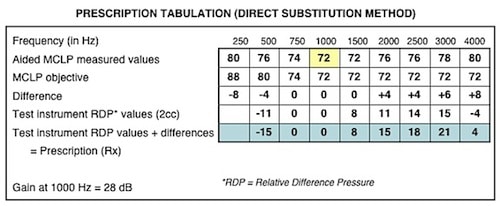
Figure 11. Otometry prescription tabulation chart using a test hearing aid in the substitution measurement method. The block in yellow highlights the reference position of 72 dB SPL at 1000 Hz. This represents the test hearing aid with the volume control adjusted for MCLP at this level. The other values on line 1 represent MCLP for those frequencies with the hearing aid fixed at this reference position. Line 2 (MCLP aided objective) is a fixed value taken from Figure 12). Line 3 is the difference between lines 1 and 2. Line 4 values are taken from the 2cc coupler measurement of the measurement hearing aid used in the test (Figure 13), and line 5 (in blue) is the eventual hearing aid prescription gain for the different frequencies, added or subtracted, of lines 3 and 4.
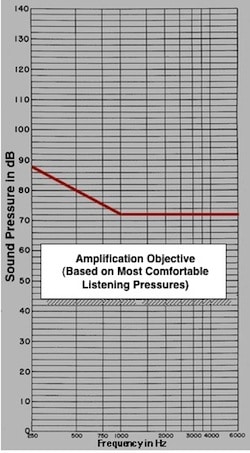
Figure 12. Free field (FF), or sound field Most Comfortable Loudness Pressure (MCLP) for normal listeners. This is also the amplified objective for aided MCLP using a damped wavetrain signal in a free field.
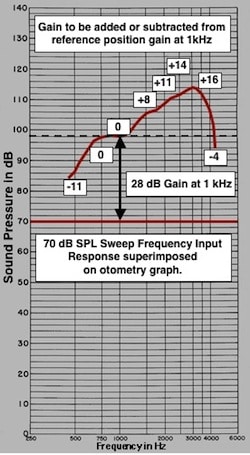
Figure 13. This is the response of the test aid measured into a 2cc coupler with an input of 70 dB SPL. In the substitution method, the test aid is referenced to 1000 Hz (MCL to 72 dB DWT input signal at 1000 Hz). The other frequencies must be referenced to the gain at 1000 Hz, the reference position. The gain values for the other frequencies are shown, as calculated from the reference position gain of 28 dB, the dotted line. These numbers represent the correction factors for the different frequencies and are reported on line 4 of the tabulation chart (Figure 11). However, some users of otometry plot the measured gain directly on line 4 (lower graph of Figure 14).
- The laboratory test aid is removed from the ear, and with the volume control still at the reference position, the aid is measured into a 2cc coupler in a hearing aid test chamber, and the response is superimposed onto the otometric chart (same graphical scale – Figure 13). In the substitution method, the test aid is referenced to 1000 Hz (MCL to 72 dB DWT input signal at 1000 Hz). The other frequencies must be referenced to the gain at 1000 Hz, the reference position. The gain values for the other frequencies are shown, as calculated from the reference position gain of 28 dB, the dashed line. These numbers represent the correction factors for the different frequencies and are reported on line 4 of the tabulation chart (Figure 11). However, and unexplained, some users of otometry plot the measured gain directly on line 4 (upper curve of Figure 14). Victoreen states that the difference in dB between 72 dB and the value actually found at any one signal frequency expresses the correction needed at that frequency. It is on this line that confusion appears in the literature when recording the prescriptive gain recommended with otometry. Instead of making the relative calculation as described, some have taken the measured 2cc gain in dB and inserted those numbers directly into line 4. Recording this way results in gain values that appear excessively high, an example of which is shown in Figure 14. If the values were taken directly from the measurement aid’s 2cc data, the gain representing the red line would result. If, however, the 2cc data were taken with the correction procedure of Figure 13, the blue line would represent the gain required for the prescription. A cursory examination of the two gain recommendations relative to the unaided MCLPs would suggest the gain of the blue line to be more appropriate, and certainly more likely for the fitted hearing aid’s volume control to manage. It is assumed that because the response configuration is the same, that compensation for the correct comfort listening level can then be made by user adjustment of the volume control. This may be fine if the hearing aid has a volume control and can be adjusted, and if it can manage the overall gain reduction required. Figure 15 provides a comparison of the tabulation data differences.
- Any deviation from the prosthetic objective in measured most comfortable loudness pressure values is then appropriately added or subtracted from the 2cc coupler frequency response of the hearing aid, and the prescription is written.
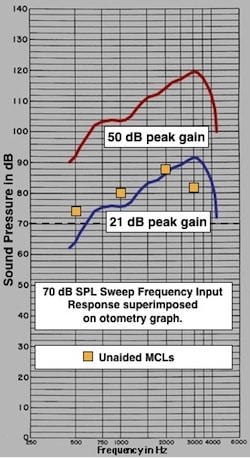
Figure 14. Prescription gain differences depending on how the values in line 4 of the tabulation chart (Figure 11) are reported. If the values were taken directly from the measurement aid’s 2cc data, the gain representing the red line would result. If, however, the 2cc data were taken with the correction procedure of Figure 12, the blue line would represent the gain required for the prescription. A cursory examination of the two gain recommendations relative to the unaided MCLPs would suggest the gain of the blue line to be more appropriate, and certainly more likely for the fitted hearing aid’s volume control to manage.
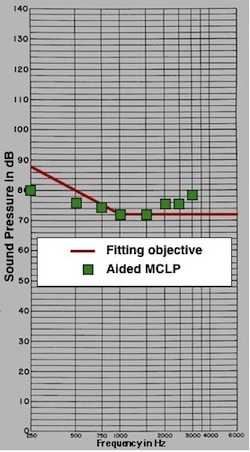
Figure 16. Amplification is to meet the red line as closely as possible if the Most Comfortable Listening Level is to be achieved. This is the amplification objective using a free field damped wavetrain signal. An acceptable limited deviation from the red line was allowed.
- Figure 16 illustrates the final step. The manufacturer has supplied the hearing aid to be fitted based on the hearing aid prescription. The hearing aid is now tested on the subject to determine how closely the measured MCLPs (green squares) approximates the target (red line). For this subject, the measured results come close to the target (hearing aid was selected based on using the relative difference pressures for the gain prescription). Additional adjustments to the hearing aid could be made if felt necessary, and depending on the ability of the hearing aid itself to be further adjusted.
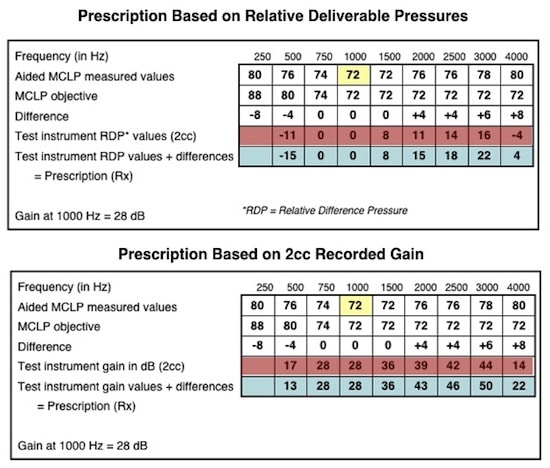
Figure 15. A comparison of the tabulation data differences (in red). The upper tabulation provides relative difference pressure (RDP) gains (in blue). The lower tabulation provides absolute gain values in dB (in blue). See text for explanation.