
Hearing Aid Selection: Consumer vs Hearing Aid Dispenser
This post is a continuation of articles on this site the last two weeks related to hearing aid selection. It is directed at answering the question: would a consumer select the same hearing aid signal processing algorithm as was recommended by an audiologist? A signal processing algorithm refers to a completely different type of functioning hearing aid, not just to single hearing aid that allowed the user to select from among different environmental conditions (quiet, noise, listening in a car, music, restaurant, etc.) by pushing a button on the hearing aid, changing the setting using on a smart phone, or by use of a remote control that allowed the same kinds of environmental listening selections.
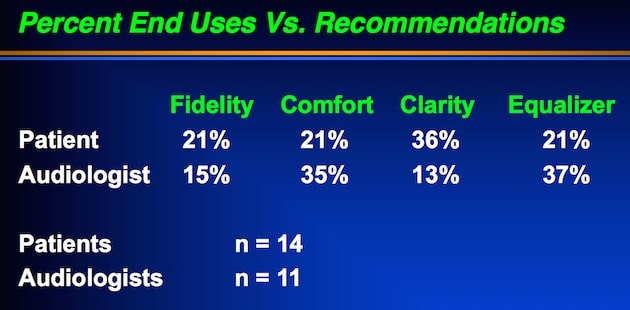
Figure 1. Patient (subject) hearing aid signal processing preference versus the signal processing algorithm recommended for that subject by eleven different audiologists having access to the same audiometric information and subject history. Of the fourteen subjects, all but one were experienced hearing aid wearers.
Last week’s post provided an overview of the study results, showing that subject preference for a given signal processing scheme (algorithm) was not the same as that recommended by the audiologist (Figure 1). Additionally, when eleven different audiologists made a signal processing scheme recommendation for the same individual, agreement was not good.
This week’s post looks at the data presented last week in greater detail, because averaged percentage data is not a good indication of the relationship of preferred use versus recommendation.
Will Consumers’ Preference for the Kind of Circuit Change Over Time?
How consistent to a given hearing aid signal processing scheme (algorithm) are hearing aid wearers when given an opportunity to change between different algorithms over time? In this study, when given this opportunity to select between essentially different hearing aid fundamental algorithms, would their preferences change after two weeks to two months?
Hearing Aid Algorithm Rank Order Preferences
Rank order preferences by the subjects for the different algorithms are shown in Figure 2 during the first week (left) versus rank order preferences after two weeks to two months (right). During the first week, seven (50%) subjects ranked the Clarifier algorithm as number 1. Even though the Clarifier algorithm dropped to about 36% after two weeks to two months, it continued to rank as the number 1 algorithm. This was a two-channel BILL (Bass Increases at Low Levels){{1}}[[1]]Killion, M. C., Staab, W. J., and Preves, D. A. Classifying automatic signal processors, Hearing Instruments, Vol. 41, No. 8, 1990[[1]]signal processor fitted according to the NAL-R hearing aid fitting formula.
The algorithm least preferred during the test was the Equalizer algorithm. This was somewhat surprising because this was a four-channel hearing aid that allowed independent programming in each channel, providing the greatest gain adjustment of all the hearing aids in the study, in approximating the gains to the fitting formula (DSL I/O).
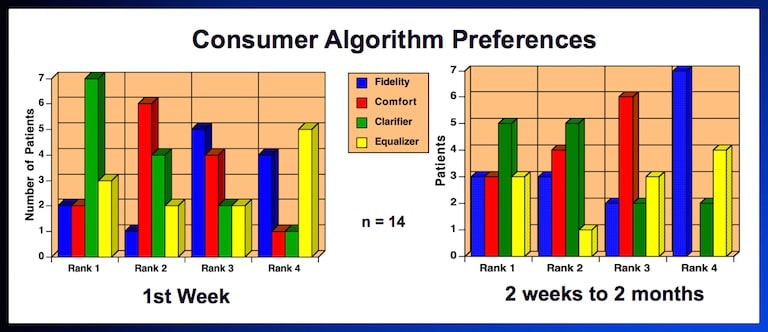
Figure 2. Consumer (subject) algorithm preferences during the first week of use (left), versus the consumer algorithm preferences after two weeks to two months (right). Each bar represents the number of subjects who preferred that algorithm.
Hearing Aid Algorithm Percent Usage by Subjects
Although Figures 1 and 2 provide general trends, it is more significant to view how individual subjects ranked the different algorithms from the first week to two weeks to two months. The percentage of time that each subject used the algorithms during this time period is shown in Figure 3.
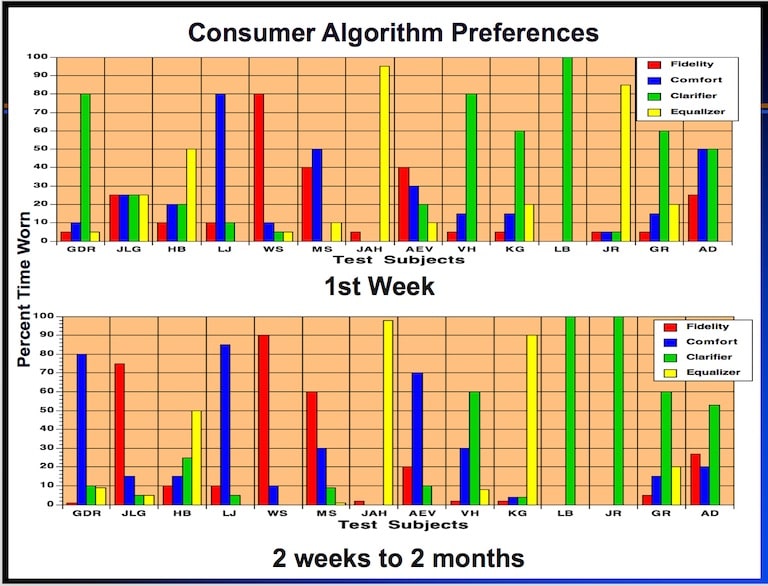
Figure 3. Individual subject algorithm selections (Fidelity, Comfort, Clarity, Equalizer) during the first week (top) versus preferences at two weeks to two months of the study. Subjects (all but one), were experienced hearing aid wearers, using the hearing aids throughout a normal day.
The data show that four of the subjects (GDR, JGL, AEV, KG, and JR) showed the greatest change in preferences, while seven of the subjects (HB, LJ, WS, JAH, VH, LB, and GR) showed the least preference changes. Regardless, significant preferences changes occurred on an individual basis during the time period of the test.
Next week’s post will conclude this series. It will include results of speech intelligibility in noise, preference comparisons from two countries for the same study, the preferred algorithms in different listening environments, and S/N intelligibility improvement.